You signed in with another tab or window. Reload to refresh your session.You signed out in another tab or window. Reload to refresh your session.You switched accounts on another tab or window. Reload to refresh your session.Dismiss alert
Is your feature request related to a problem? Please describe.
Been able to use binning and clustering in a web map is great, but just showing predominant values might be misleading sometimes, as explained in this demo.
Describe the solution you'd like
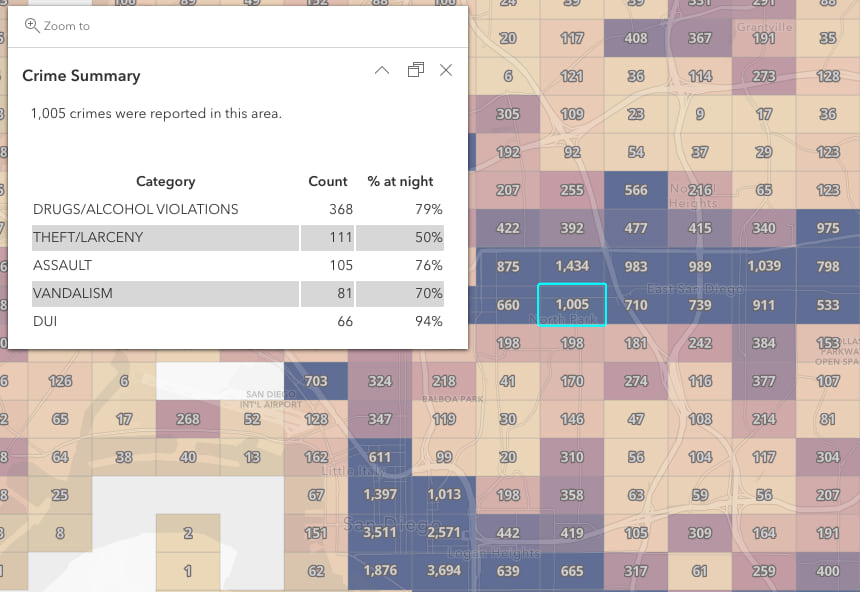
Been able to visualize a table with aggregated statistics is a great way to include additional information:
Describe alternatives you've considered
Build a custom code in each application/language that uses the web map.
Check existing issues
Execution profile
Popup
Is your feature request related to a problem? Please describe.
Been able to use binning and clustering in a web map is great, but just showing predominant values might be misleading sometimes, as explained in this demo.
Describe the solution you'd like
Been able to visualize a table with aggregated statistics is a great way to include additional information:

Describe alternatives you've considered
Build a custom code in each application/language that uses the web map.
Additional context
This article and this web map contains an example that can be repurposed.
The text was updated successfully, but these errors were encountered: