Jun 20, 2023 - Franky Jr Blondeel Updated: Sep 07, 2023 - Franky Jr Blondeel (added info about extra options and updated some links)
Live version here
Dashboard (yes, I know the name is VERY generic) is the crown jewel of my time working with APIs. It's been quite a while since I've written and posted something on my GitHub, but I've just been busy with different other little project to do with developing. Spoiler alert: applying for jobs also takes a lot of time 😂
But that's a good thing I guess!
Dashboard has been ready for quite a while though, a couple of months in fact. But I wanted to sign this assignment off officially by writing this little article about it.
The main goal was to interact with different APIs here, and bring it all together in a nice little dashboard, that can be used as an extension in Chrome.
And I went above and beyond on this one, just because I enjoyed it so damn much.
I wanted not only a set of different APIs. But I wanted to save data in local storage, so the thing remembers the choices users make. I wanted efficiency. Only call APIs when necessary. And I wanted to have it look good as well. But most of all, I wanted to have fun with it. And I'm proud of the result.
Like I already mentioned, this dashboard app is the final assignment in the APIs chapter of the course I'm following over at scrimba.com. And it has been an amazing ride.
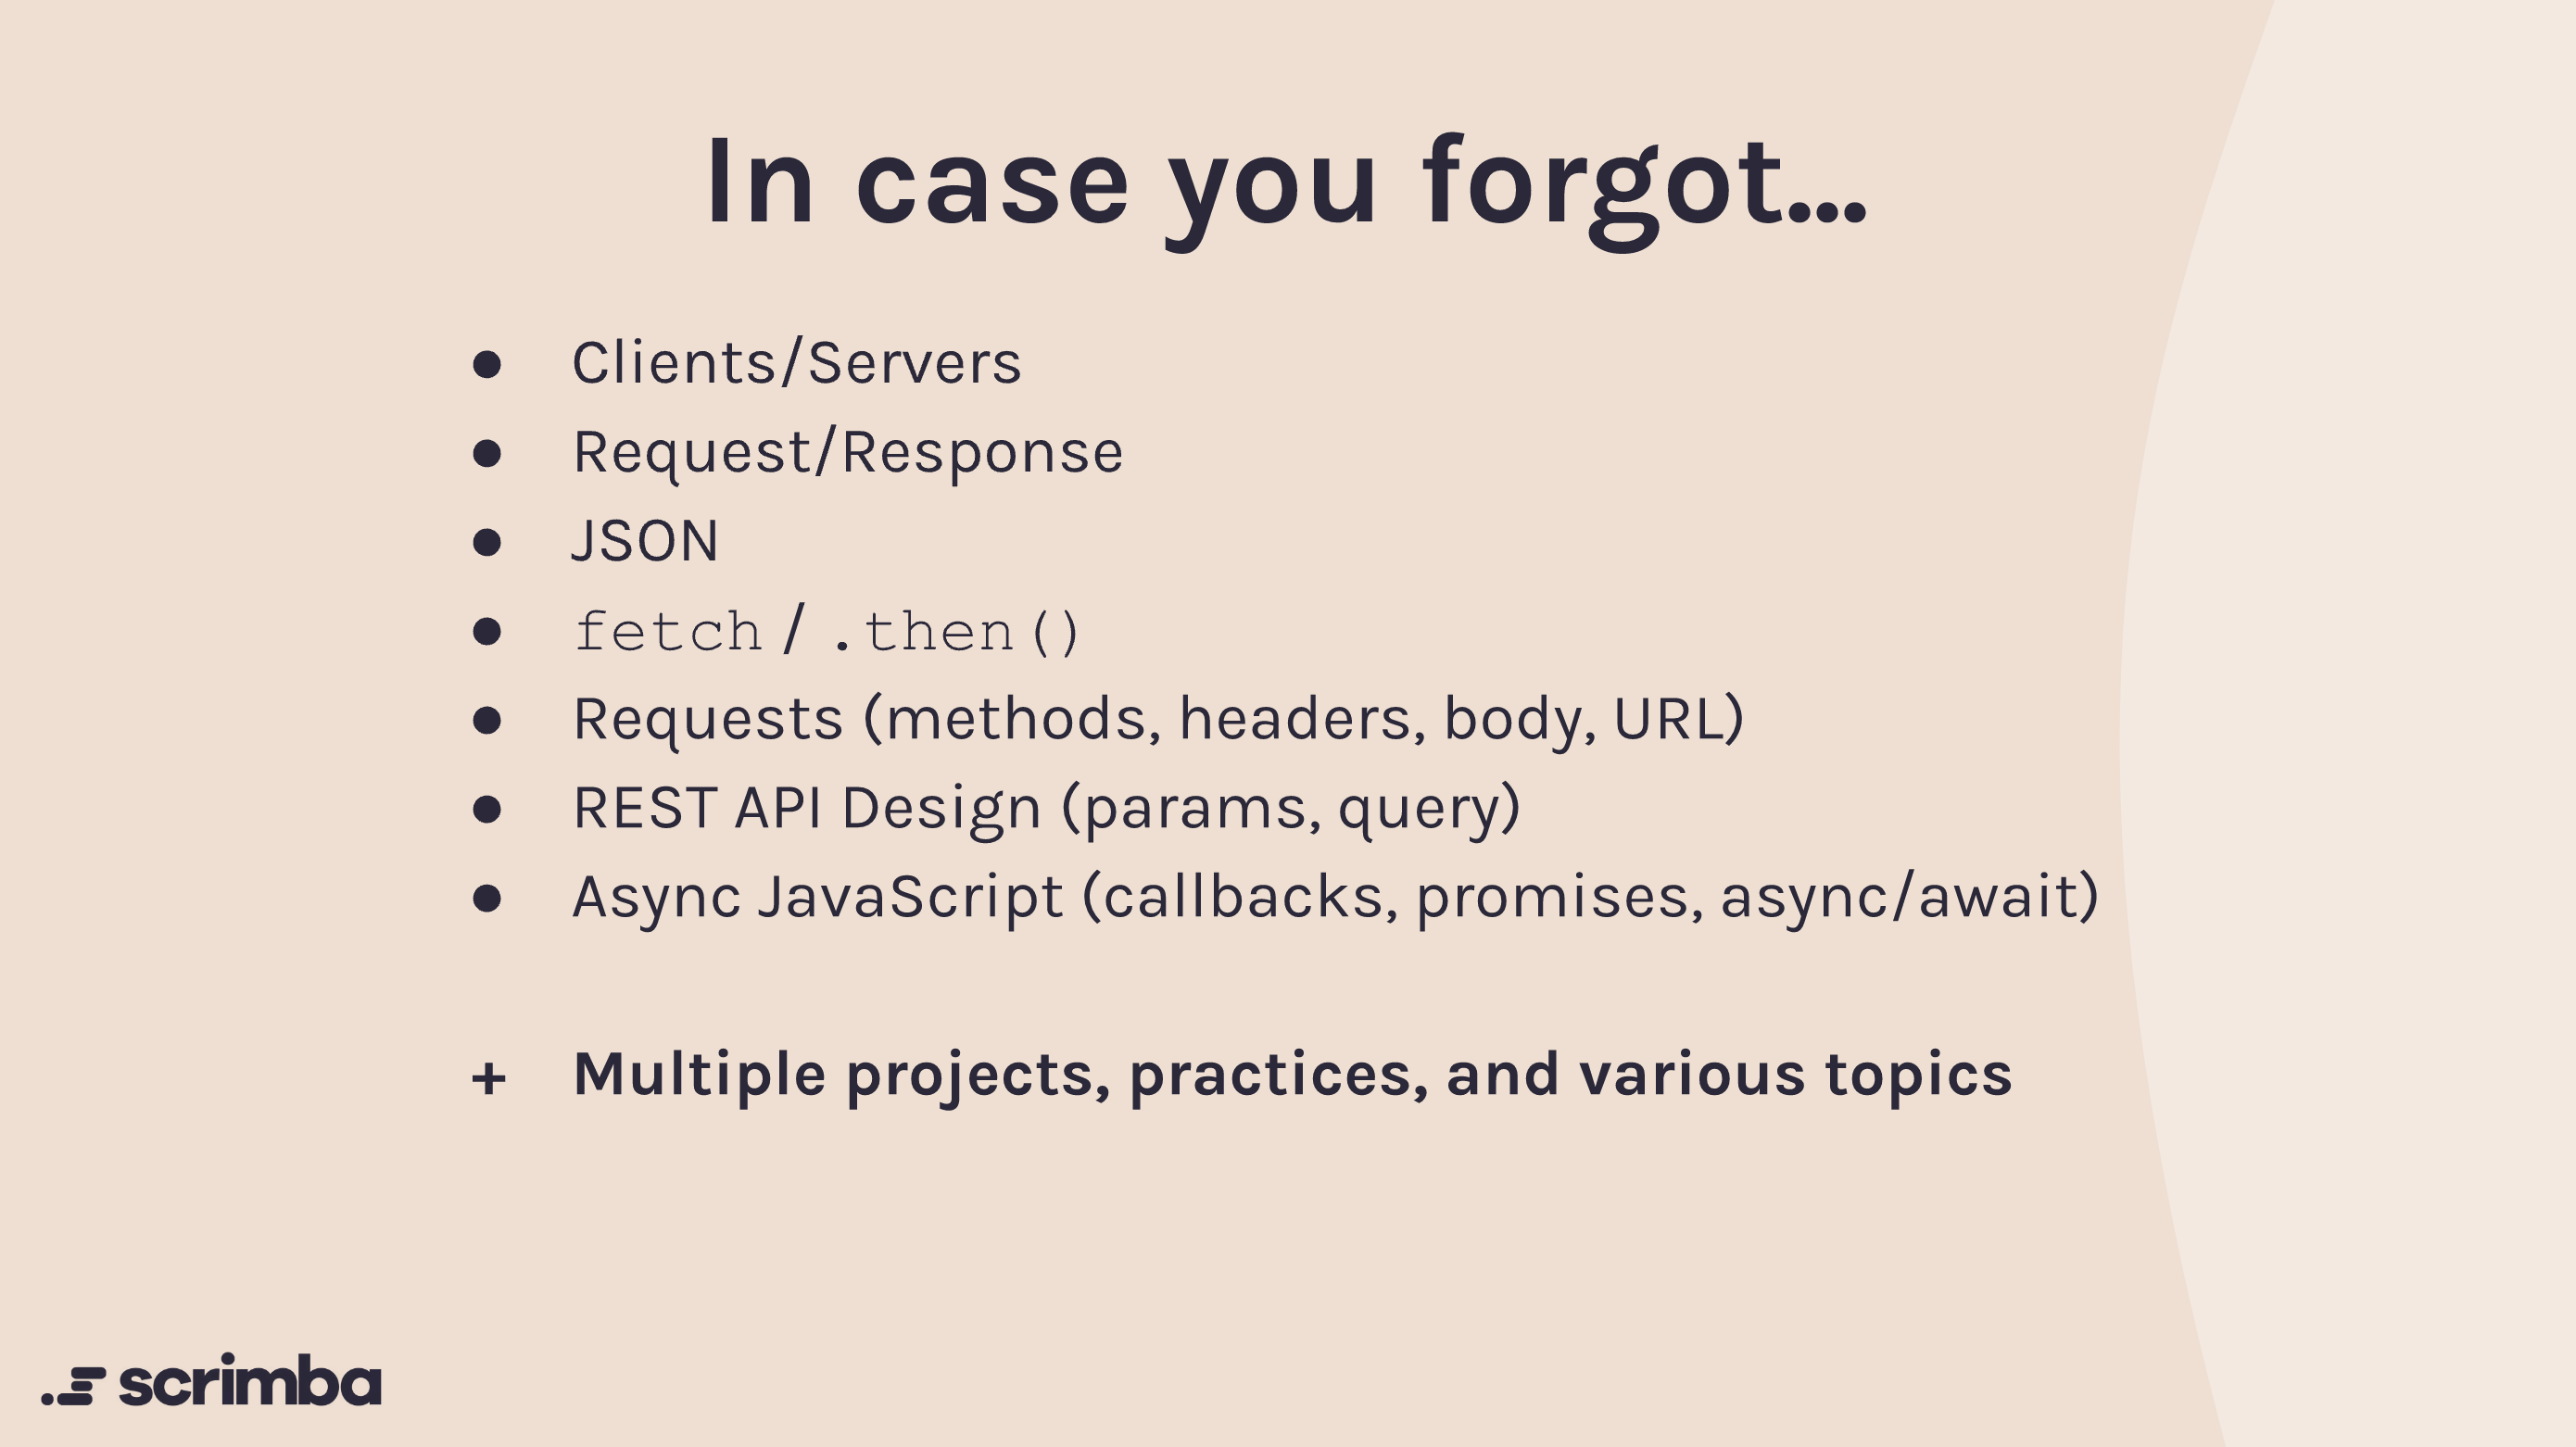
Here are some of the subjects we discussed in the chapter
Some of the stretch goals given by the lecturer included:
And I think I delivered. Let's dive a bit deeper...
I started out with the simple stuff. The date & time is simple Javascript, and it gets updated every second, so it stays up to date with the current date and time
I like my clocks in 24h format, and at a certain point I thought of adding functionality that allowed the user to select in which format they wanted to display the clock. This would have been a nice addition and played right into the features I wanted to add anyhow. But I dropped it in the end in favor of different features. Which does not make it impossible to add in the near future of course 😊
The ultimate goal of the app is that it would be shown each time a user opens up a new tab on their browser, a nice background is there to greet them with some beautiful cityscape or a piece of nature. What better source to call than Unsplash. They're API is easy to interact with, and allows some flexibility, as in, you can define parameters and such of the types of backgrounds you want to call.
One of the parameters I noticed, is that you could deliver a 'retina-ready' type background, meaning, much higher resolutions. So I had built a function at one point, that would detect the user's screen DPI, and it would update if they dragged the window to a different type screen. The retina images were huge though, and it ended up ruining the experience. I probably need to play around with it a bit more to better understand it, but I canned this feature in the end and instead went for just regular images. In the end though, who would notice? This thing needed to be fast, and functional.
At a certain point I also wanted to give the possibility for users to add their own choices for the types of backgrounds to load. But again, this was 'not challenging' enough and pretty straight forward. I would not have learned as much with this, so I again dropped this feature in favor of other details I added.
But I've gotta say, I really grew to love unsplash, and it just cheers me up using the Dashboard on a daily basis. They really really shine!
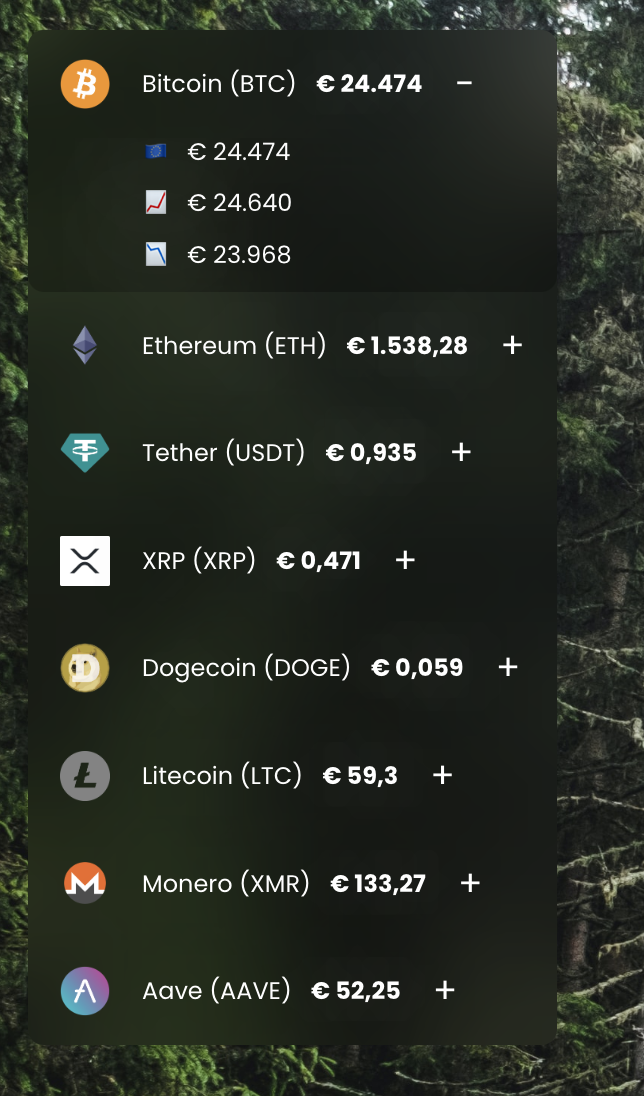
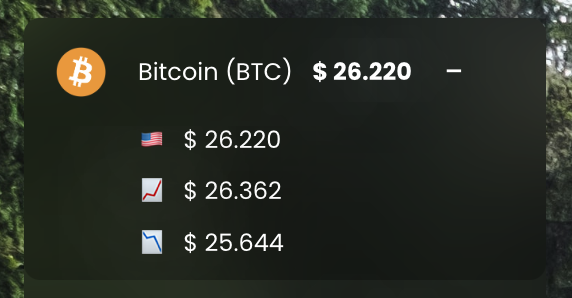
Now, I'm not too big into crypto myself. I have some and I have dabbled into NFTs too. The Web3 technology as a whole I find real interesting though, and it is one of the future paths I see myself taking as a developer. However, for this assignment, we were asked to integrate with the CoinGecko API to pull down crypto information.
Fairly straightforward implementation as the Coingecko API documentation is very clear.
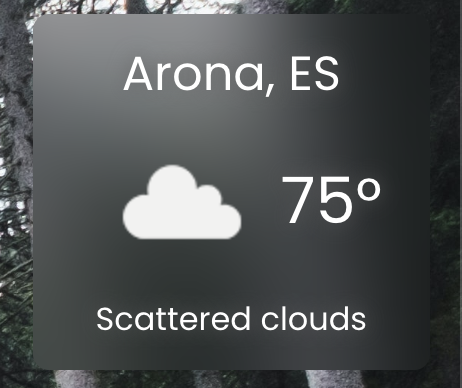
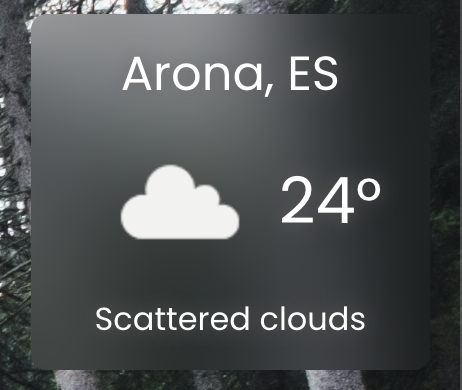
Weather is powered by the OpenWeather API and is driven by the user's location. Outside of interacting with the (very straightforward) OpenWeather API, I learnt a lot about the Geolocation API that is supported by modern browsers.
Pulling down the weather was a very interesting journey altogether for me, as I was working on this assignment in a more remote region during my holidays in Italy. What I noticed there is that the Geolocation API would very often time out when trying to determine my location. I started searching for various fall-back mechanisms or some error handling to provide a better user experience all around. Unfortunately, it was not as easy as I had thought and very often the alternative geolocation API's out there required investing money.
So in the end, I decided to opt for an event that gets triggered when the Geolocation API times out, and it will display an error and updated graphic to reflect the error.
Alternatively, I wanted to implement a manual location selection option in the user preferences menu (which I'll discuss in detail later), but it did not make the cut in the end as I already implemented different other preferences that had me learning more than a simple weather location option would've ever managed to do.
I played around with various weather services out there, mostly because I initially did not really like the graphics displayed by the OpenWeatherAPI. But hey, graphics are just that, and all other weather services I found out there to interact with were never as 'friendly' when it came to their pricing as OpenWeather was. When a user clicks the graphic, they also get taken to a page with a more detailed weather forecast.
This was an incredibly interesting part of the journey and I'm so glad I took the time to finish this feature the right way! (IMO)
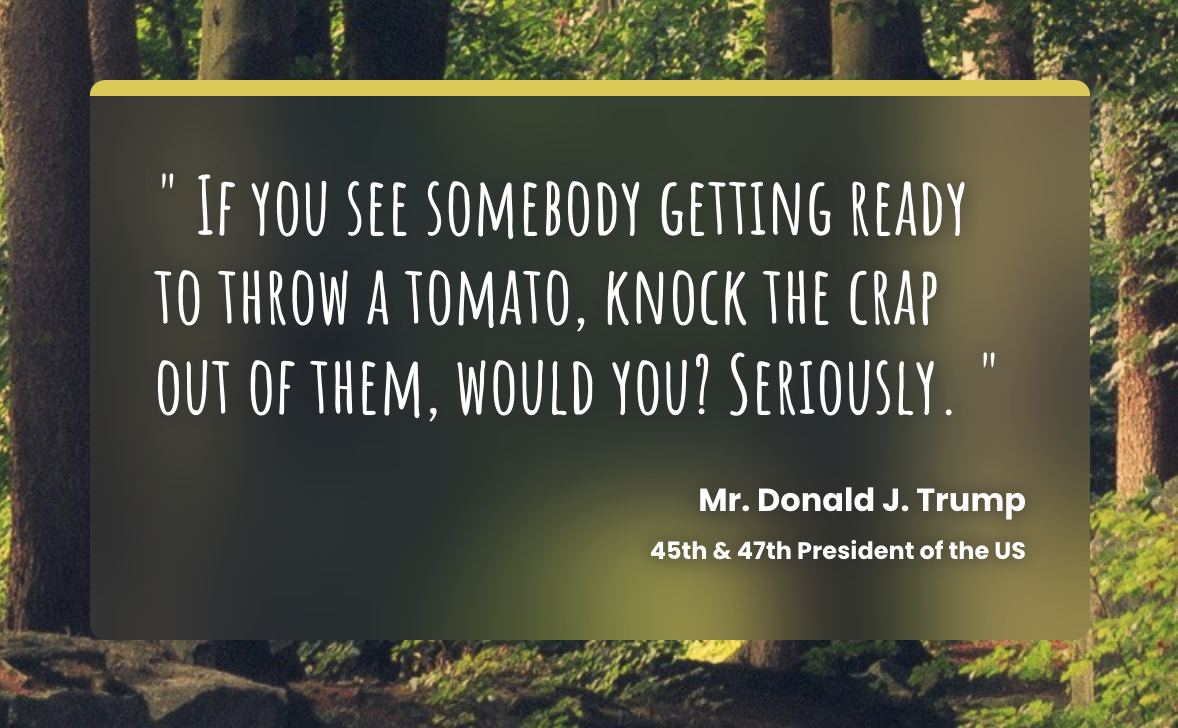
Just to cram some more APIs into the page, one idea I had was to add a 'daily' quote kinda thing on the front of the page. I looked at the various options out there, and since I discovered that Trump was running for president again, I wondered if there was any API out there that collected Trump's best work out there. Queue: Tronald Dump API. This API collected Trump's worst(/best?) tweets out there and collected them. I thought this would be the funniest option, so I went for that. I've gotta say, I'm really enjoying my Trump tweets!
I have spotted the fact that Tronald Dump seemed unreachable for a while now and quickly implemented a new api connection to WhatDoesTrumpThink.com. Functionally, nothing really changed. But go give these guys a visit, they're able to generate some funny, personalized, quotes. API reference can be found here.
The app wouldn't be complete with a couple of my own touches to it. Obviously, I wanted it to feel nice to interact with, so I added some visual queues and animations to make everything flow better.
Also, as a good developer, I needed to credit my sources of the the data. So I implemented a small info-modal that the user can access via a button on the bottom.
The main question for me though, was 'How could I improve the app for the user? Make it more personable?'. Especially because that is just what it is: it's a personal dashboard and without any customizations, the thing would basically be useless to anyone other but myself. This then introduced the question: how will I store the personalizations. Etc..etc.. New ideas flow and new problems to solve arrive with it 😅
But this is fun, and it's exactly where I want to be!
Since I needed a spot to save any potential settings by the user, I looked around. Did I need to introduce a database? Probably not. So LocalStorage it is. It works well with the concept of this thing being a Chrome Extension too.
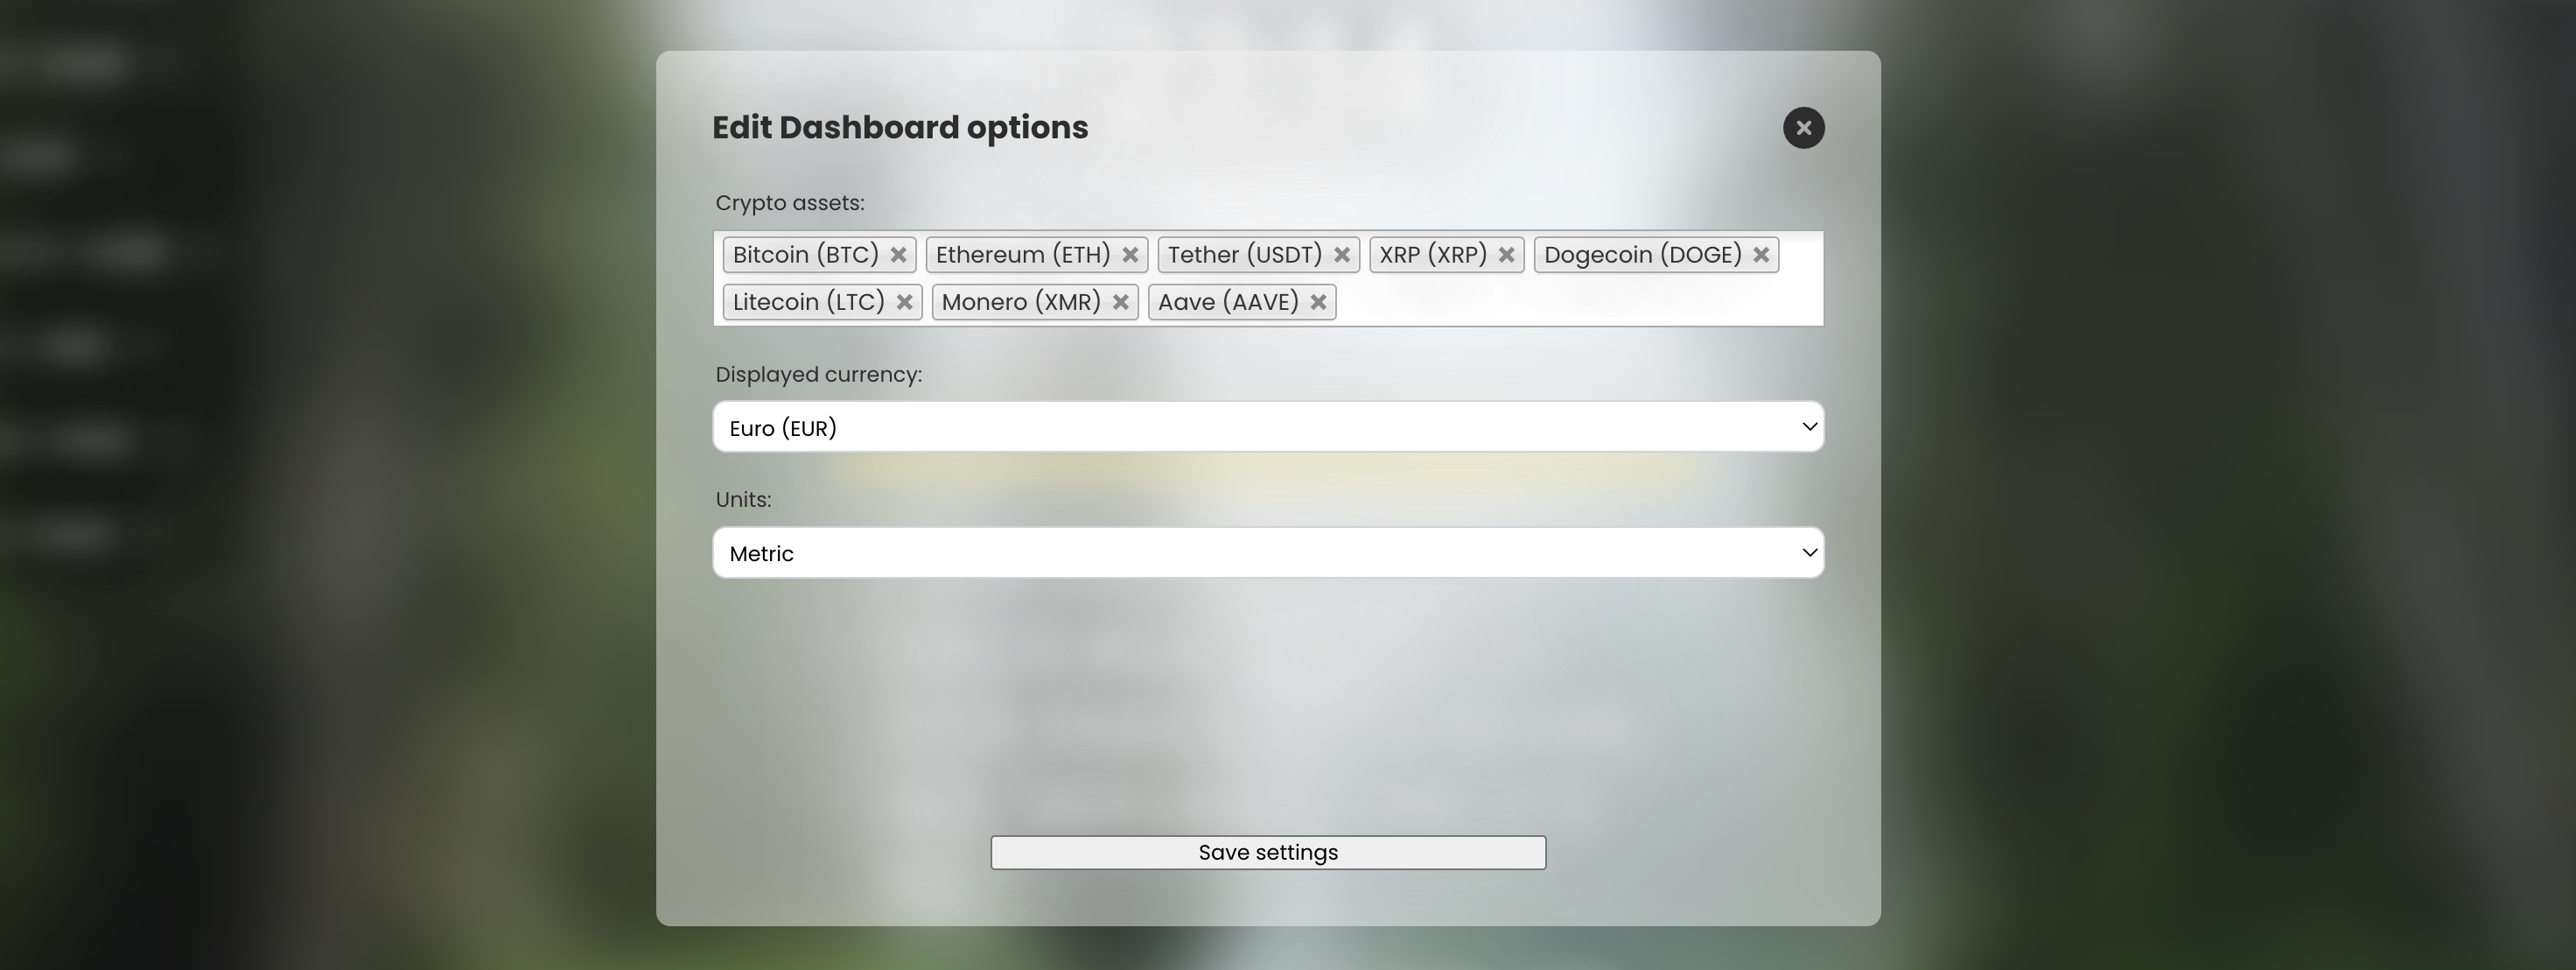
So I designed and implemented a quick Preferences modal, where the user would edit their settings.
Next up, I needed to decide on the scope of the settings that they could edit. Now, I could've gone very far with this. But again, I'm on a learning journey here, so I wanted to pick the items that would give me the biggest gains in knowledge and deep dives into the unknown.
The way I went to work here is to examine what other options the APIs I used had on offer. Were there any extra options I could pass to pull down a more personal experience for my users?
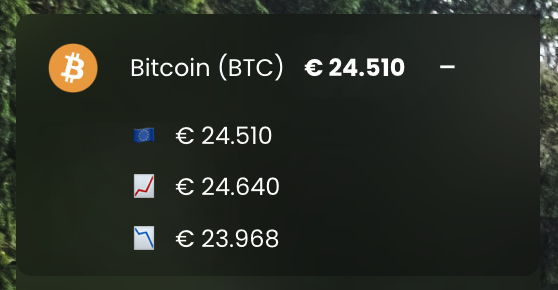
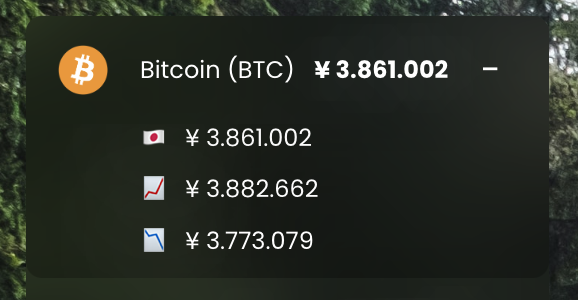
What I decided was to let the user determine which crypto assets to sync (which introduced a lot of new questions and problems!!). On top of that, I wanted my user to be able to switch which currency they display when looking at the values of the cryptos.
For the weather, I already said I had the idea to let the user choose their custom location, but I dropped this as it would prove to be quite some (dare I say) uninteresting work 🙊 What I did give the user is the option to determine their units to display the weather in.
From that point on, I decided on the simple datastructure in my LocalStorage, and decided on a couple of default values to load in upon first load. Et voila, the preferences modal was born (sort off...).
Now... the feature to select which cryptos you want to display on the screen was a difficult one to complete. Especially since I found out that a 'simple' multi-select dropdown (preferably WITH search) does not exist, at least not with standard HTML and CSS tools! That is crazy! And yet here we are in 2023. So I had to find my own solution out there. Ended up banking on Chosen, some sort of JQuery plugin. It must've been over 10 years since I used JQuery, but it was an interesting journey getting it to play nice with the rest of my more modern JS.
It worked though. And it works well. Fun fact: the source for generating/populating the list is also CoinGecko. I launch an API call on launch and fetch the top 100 most popular crypto's from their site.
Additionally, I allowed the user to select their currency of choice to display the value of their favorite crypto. Their choice is also clearly reflected with an emoji in the UI. Pretty neat!
For the weather, I kept it very simple: Users can change the units that are displayed on their screens. It's a very simple adjustment in the code and gives the users something extra.
Like I said, I contemplated a lot of different ideas, especially to do with the location of the user. However, I considered this scope-creep for now, and these options are on my backlog. So many ideas, so little time.
Performance is key! So I did some small optimizations as I was adding features to the app. One such thing optimization are for instance the list of the most popular cryptos. Or the location of the user. Since the purpose of this app is to live as a 'new tab' dashboard in Chrome, this is typically not information I need to fetch every single time. User's can potentially open up 100's of tabs in an hour and it would just slow things down unnecessarily. (and not in the least rack up unnecessary API calls to my different providers). So what I did is stored the date and time of the last fetch and decided on a specific amount of time for my app to keep using this data. Once the data is older than X-number of milliseconds, I launch a new fetch to get updated data.
I also tried to keep my code as clean and as modular as possible. Writing this months and months after finishing the assignment, I can honestly say it was a nice experience going back into my code to discover how I had solved certain issues.
There is so much I can say about this assignment! I discovered so many new thing that I had never heard about, it was amazing. Also, the fact that I now daily-drive this extension in my chrome browser is awesome too. To be reminded of your own work, every day, is sooo nice! Additionally, new problems and things to learn basically automatically offer themselves up as you're thinking of new nice things to implement. There's always a new problem that comes with a new feature. And things are never as easy as they at first seemed, that's for sure. But this is a learning journey and that is what it's all about! I loved every second of digging and trying. And even when it was frustrating, it STILl ended up being enjoyable in the end. Just because I know that I'm just a tiny bit better at this than I was before. LOVE-IT!


