-
|
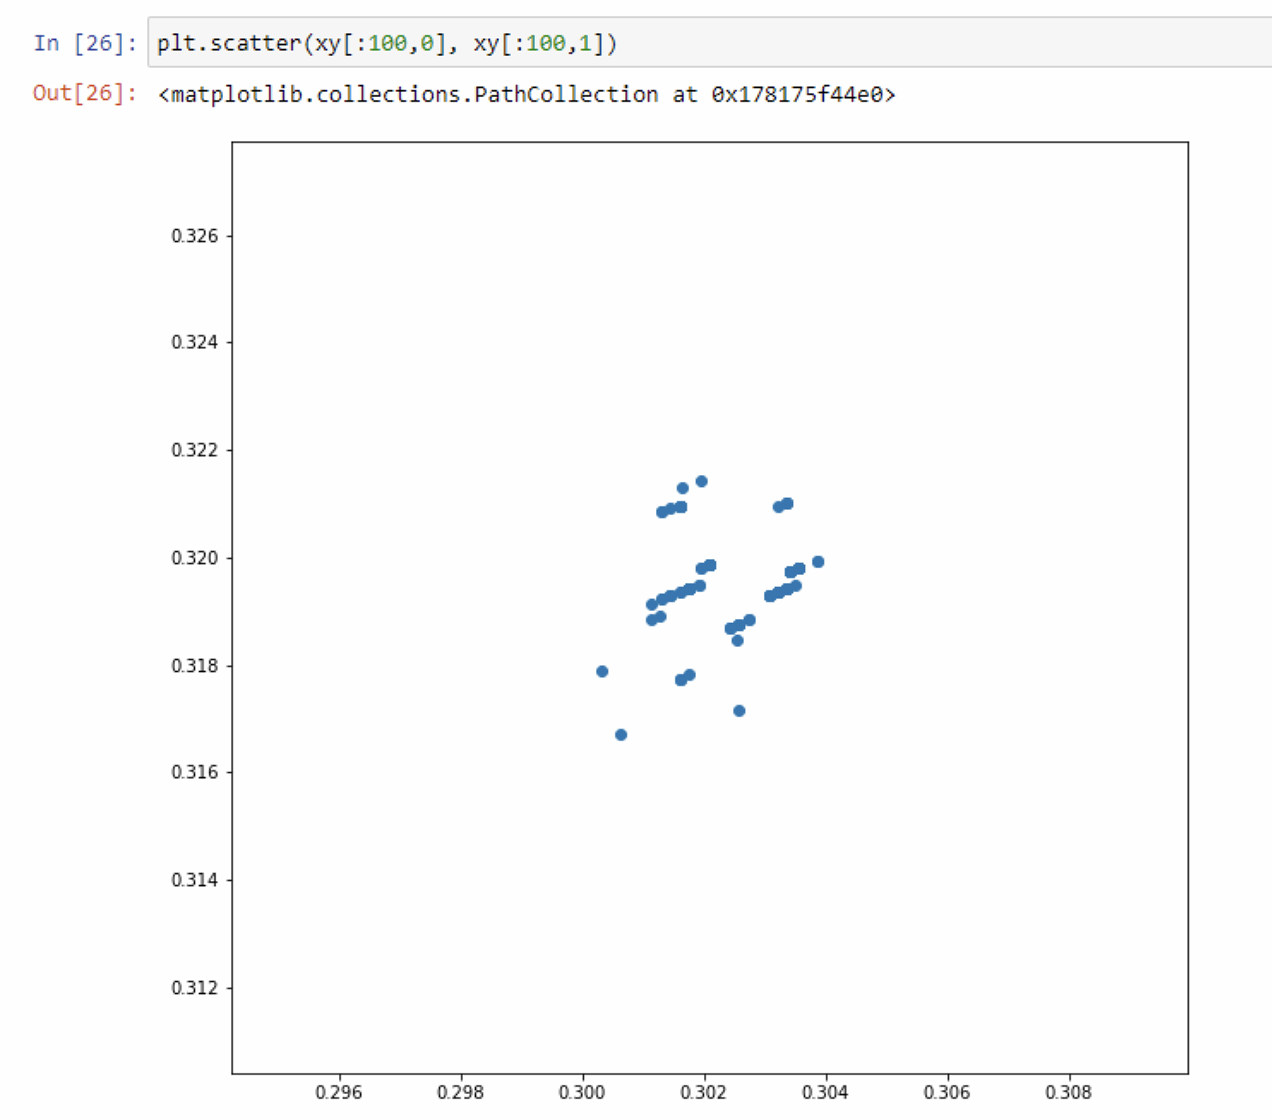
Hi, Could you show me how to plot on top of existing figures? What should I do in my case? |
Beta Was this translation helpful? Give feedback.
Replies: 7 comments
-
|
Hi @hminle, Jupyter Notebook tends to display the figure/axes immediately if the last result from a call is a figure or an axes. Try to put everything in a single cell. |
Beta Was this translation helpful? Give feedback.
-
|
Hi @KelSolaar , |
Beta Was this translation helpful? Give feedback.
-
|
Note that if you are interested with plotting image chromaticities there is that definition that does the heavy lifting for you: https://colour.readthedocs.io/en/develop/generated/colour.plotting.plot_RGB_chromaticities_in_chromaticity_diagram_CIE1931.html#colour.plotting.plot_RGB_chromaticities_in_chromaticity_diagram_CIE1931 https://colab.research.google.com/drive/1NRcdXSCshivkwoU2nieCvC3y14fx1X4X#scrollTo=6PlESt8vGeeT |
Beta Was this translation helpful? Give feedback.
-
@KelSolaar Thank you very much. It's exactly what I need 👍 👍 |
Beta Was this translation helpful? Give feedback.
-
|
@KelSolaar you guys should put the colab notebook here |
Beta Was this translation helpful? Give feedback.
-
|
So it should be linked here close to the top! |
Beta Was this translation helpful? Give feedback.
-
oh nice, I did not notice about it. Thank again :) |
Beta Was this translation helpful? Give feedback.


Hi @hminle,
Jupyter Notebook tends to display the figure/axes immediately if the last result from a call is a figure or an axes. Try to put everything in a single cell.