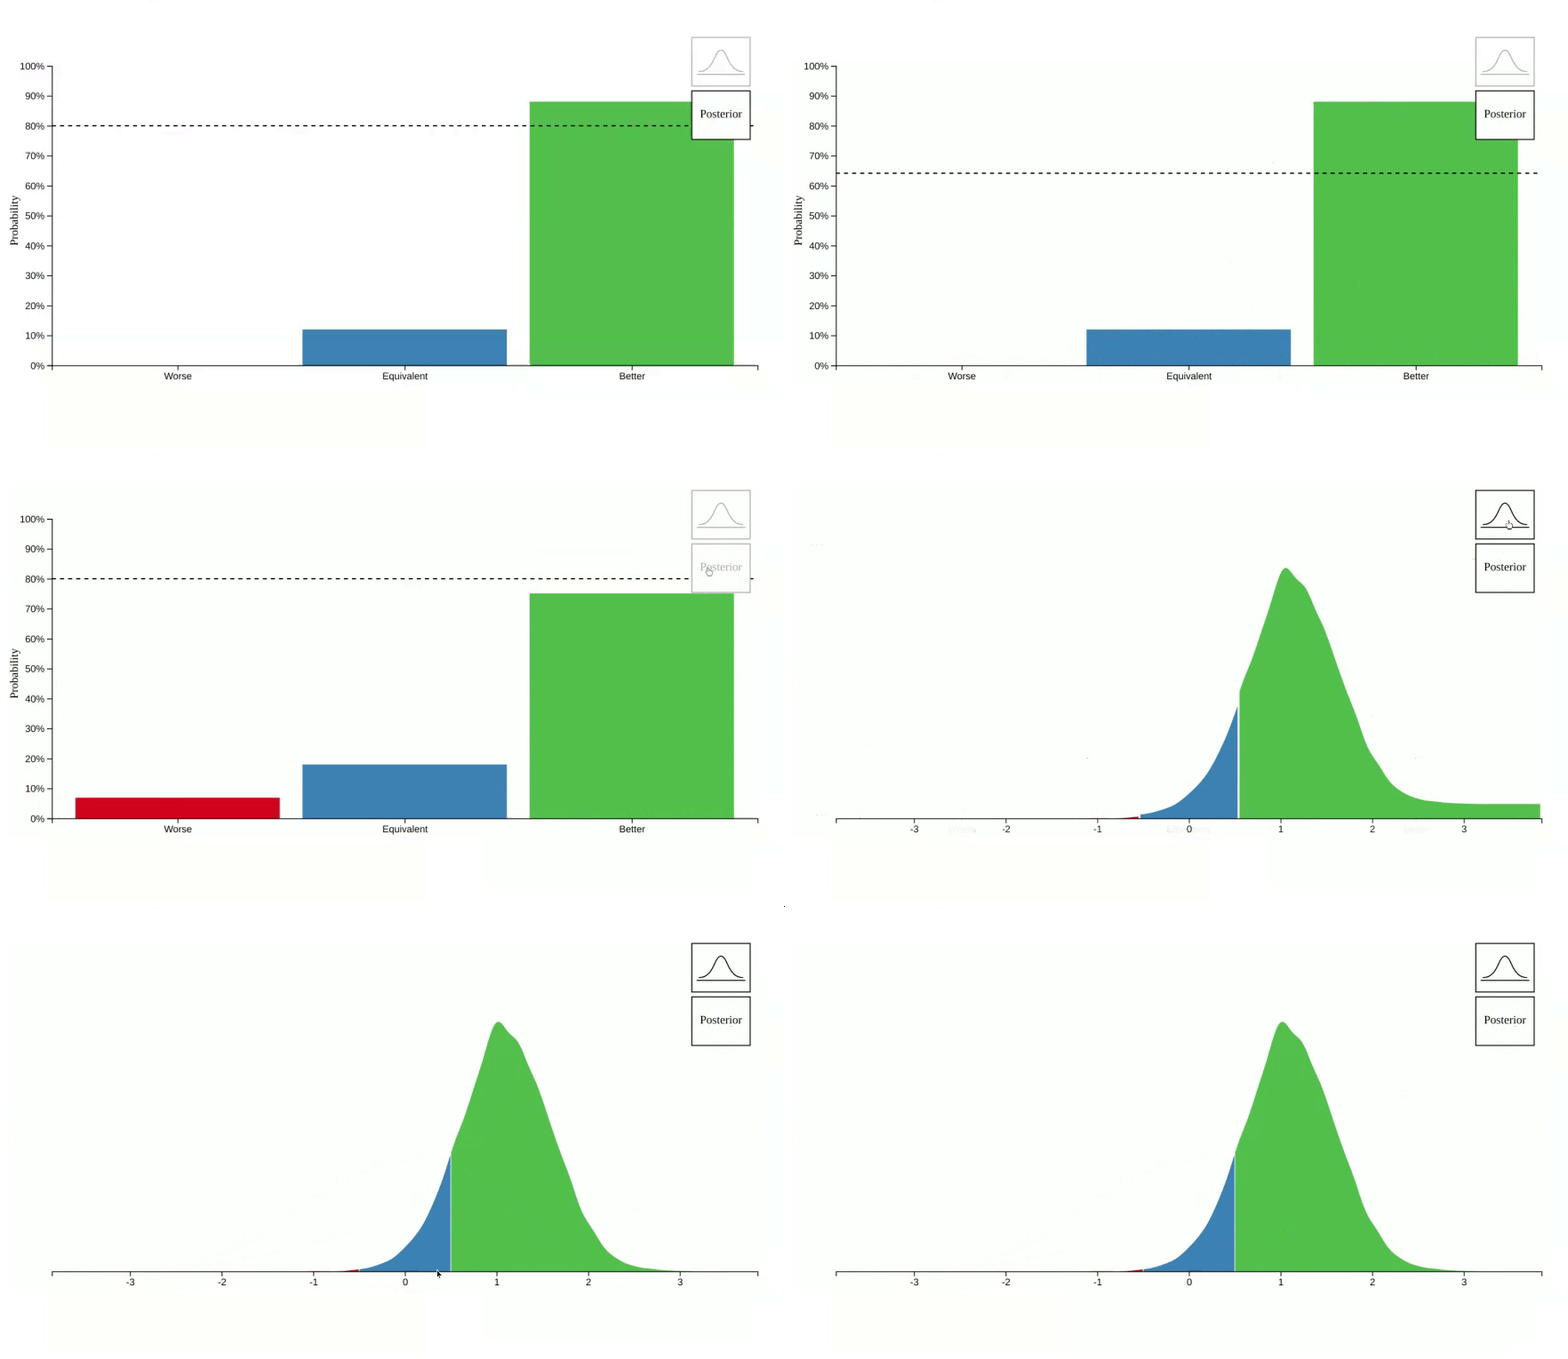
vizdraws creates interactive visualizations using draws from a prior and posterior distributions.
install.packages('vizdraws')The latest development version can be installed from github:
# install.packages("remotes")
remotes::install_github('ignacio82/vizdraws')This is a example which shows you how to how to visualize the transition from the prior to the posterior:
library(vizdraws)
set.seed(9782)
vizdraws(prior = rnorm(10000, 0, 1), posterior = rnorm(10000, 1.1, 0.5), MME = 0.5, threshold = 0.8)The bell-curve icon was created by Davo Sime.
