Sample analysis of NEI public data about air contamination in USA
The public data about PM2.5 contamination is available for download from a single zip file:
Data for Peer Assessment [29Mb]
The zip file contains two files:
PM2.5 Emissions Data (summarySCC_PM25.rds): This file contains a data frame with all of the PM2.5 emissions data for 1999, 2002, 2005, and 2008. For each year, the table contains number of tons of PM2.5 emitted from a specific type of source for the entire year. Here are the first few rows.
##     fips      SCC Pollutant Emissions  type year
## 4  09001 10100401  PM25-PRI    15.714 POINT 1999
## 8  09001 10100404  PM25-PRI   234.178 POINT 1999
## 12 09001 10100501  PM25-PRI     0.128 POINT 1999
## 16 09001 10200401  PM25-PRI     2.036 POINT 1999
## 20 09001 10200504  PM25-PRI     0.388 POINT 1999
## 24 09001 10200602  PM25-PRI     1.490 POINT 1999
fips: A five-digit number (represented as a string) indicating the U.S. county
SCC: The name of the source as indicated by a digit string (see source code classification table)
Pollutant: A string indicating the pollutant
Emissions: Amount of PM2.5 emitted, in tons
type: The type of source (point, non-point, on-road, or non-road)
year: The year of emissions recorded
Source Classification Code Table (Source_Classification_Code.rds): This table provides a mapping from the SCC digit strings in the Emissions table to the actual name of the PM2.5 source. The sources are categorized in a few different ways from more general to more specific and you may choose to explore whatever categories you think are most useful. For example, source “10100101” is known as “Ext Comb /Electric Gen /Anthracite Coal /Pulverized Coal”.
You can read each of the two files using the readRDS() function in R. For example, reading in each file can be done with the following code:
## This first line will likely take a few seconds. Be patient!
NEI <- readRDS("summarySCC_PM25.rds")
SCC <- readRDS("Source_Classification_Code.rds")
as long as each of those files is in your current working directory (check by calling dir() and see if those files are in the listing).
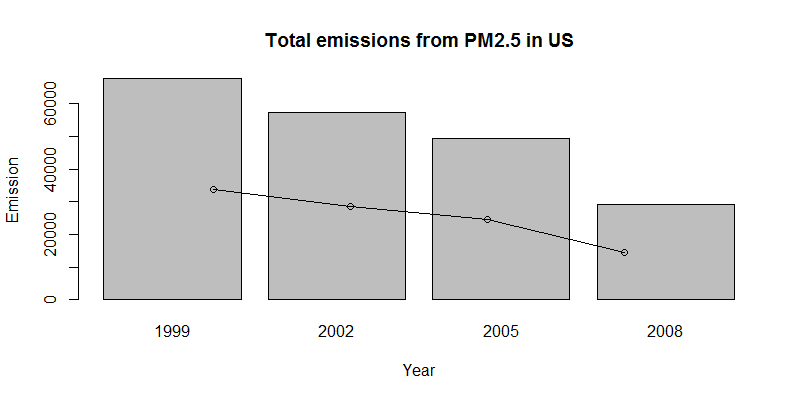
There was a constant decrease in the US of total PM2.5 emission during years 1999-2008.
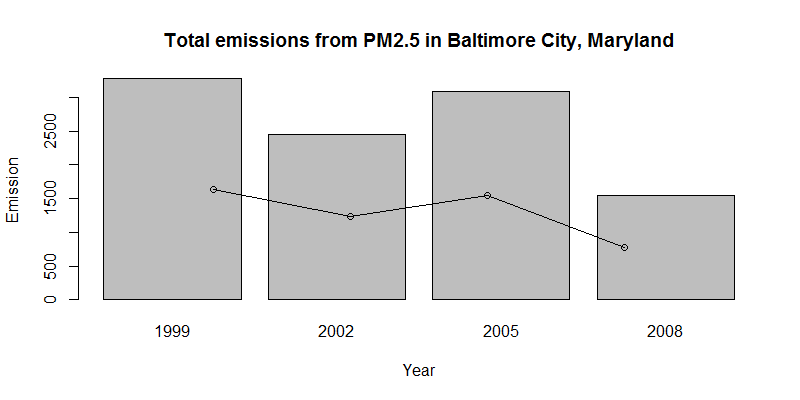
Total PM2.5 emissions (between years 1999-2008) have decreased (in general) for the Baltimore City, Maryland.
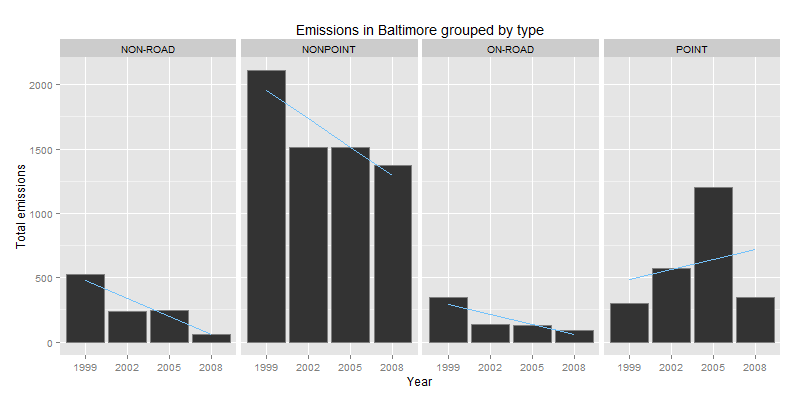
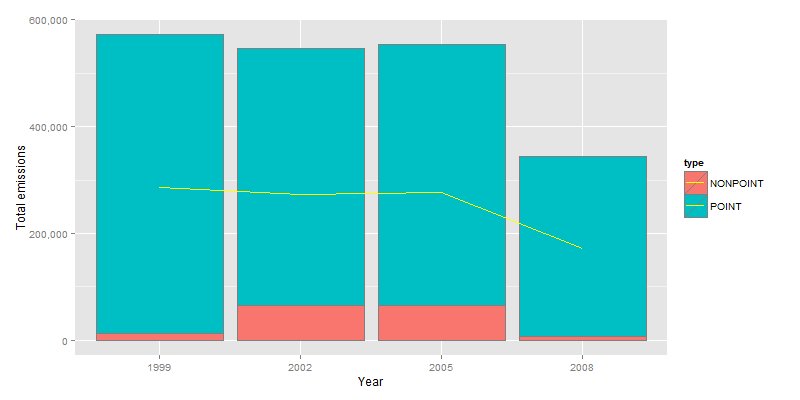
Nonroad, nonpoint and onroad seen a decrease during years 1999-2008, Baltimore City. Results for point type are inconclusive - there was an increase between years 1999-2005, until year 2008, when it saw a huge drop.
During years 1999 - 2005, there was a steady level of coal combustion-related contamination (around 570k yearly), but during last year (2008) this level decreased much below 400k.
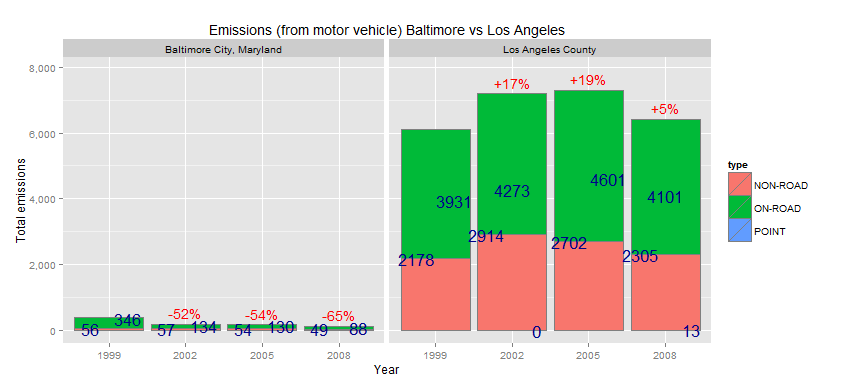
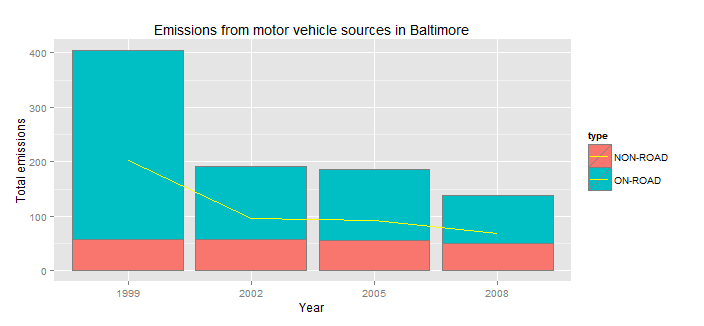
Emissions from motor vehicle sources decreased between years 1999 - 2008. While there was a constant emission from non-road sources, on-road contamination was decreasing constantly through years.
Baltimore City has a greater change of emissions over time as compared to Los Angeles. Baltimore City in the first year (2002) reduced emissions by 52%, finally in the year 2008 Baltimore had 65% less emissions as compared to the situation in year 1999. Los Angeles had different levels of increase in emissions during years, with a threshold of 19% as compared to year 1999. In the year 2008 Los Angeles County still produces more emissions than it was in the year 1999 (5% more percent).