Cohort
In this tutorial, we gonna explore briefly how to use SCALPEL-Analysis to conduct an interactive analysis of a study and its main abstraction: the Cohort.
The tutorial assumes that you have been given a valid Metadata JSON file, a file which is a result of SCALPEL-Extraction.
%matplotlib inline
%load_ext autoreload
%autoreload 2
%config InlineBackend.figure_format = 'retina'

import pandas as pd
pd.set_option('display.max_rows', 500)SCALPEL-Analysis is not yet available through PIP or Conda channels to be installed. However, as is the case for any Python library, it is pretty straight forward to add and use.
Before, proceeding you will need to download SCALPEL-Analysis as a zip from here. Put the zip wherever you judge suitable for you. Please make sure that you meet all the requirements explicited here.
I have downloaded the zip file, and put it under the path /home/user/builds/dist/scalpel.zip.
There is two ways of doing it:
- Permanently add a directory to PYTHONPATH environmment variable. This will allow you to add it once and for all.
- Add it through
sysimport as shown below.
import sys
project_path = '/home/user/builds/dist/scalpel.zip'
sys.path.append(project_path)As stated in the first comment cell, you will need to import the Metadata JSON. There is a straightforward way of doing it that will save the pain of a lot of boiler plate code. The following cell shows how.
from scalpel.core.cohort_collection import CohortCollection

cc = CohortCollection.from_json("metadata_fall_2020_01_27_16_46_39.json")
cc.cohorts_names
{'Cardiac',
'HTA',
'IPP',
'Opioids',
'acts',
'control_drugs_exposures',
'control_drugs_purchases',
'diagnoses',
'drug_purchases',
'epileptics',
'exposures',
'extract_patients',
'filter_patients',
'follow_up',
'fractures',
'interactions',
'liberal_acts',
'prescriptions',
'prescriptions_exposures'}
Right, we officially have a CohortCollection with a number of of Cohorts. But wait, what it is a CohortCollection? No rush, here is the definition from the SCALPEL paper, section 2.5:
The
CohortCollectionabstraction is a collection ofCohorts on which operations can be jointly performed. TheCohortCollectionhas metadata that keeps information about eachCohort, such as the successive operations performed on it, the Parquet files they are stored in and a git commit hash of the code producing the extraction from theSource.
CohortCollection can be seen in the same way a list or dict in Python is seen. It is a bag full of Cohorts that allows to iterate over, but also allows to apply operations to all the Cohorts at once. Finally, it allows to do specific operations for the CohortCollection such as finding the basic subjects Cohort which is the largest Cohort in the CohortCollection. We have a dedicated tutorial for CohortCollection.
The aim of this tutorial is to show how to analyse Cohorts. But before, lets define what a Cohort is:
The
Cohortabstraction is a set ofSubjectsand their associatedEventsin a [startDate,endDate] time-window. Basic operations such asunion,intersection, anddifferencecan be performed betweenCohorts, while a human-readable description is automatically updated in the results. More granular control is kept available through accesses to the underlying Spark DataFrames (using Spark DataFrame API). This combination allows for easy data engineering and fine-grained yet reproducible experiments.
Lets see what we can do.
# Get the fractures Cohort
fractures = cc.get('fractures')

# Print a description of the cohort in a humanly readable fashion
fractures.describe()
'Events are fractures. Events contain only subjects with event fractures.'
# See what charachterises the Cohort

fractures.characteristics
'subjects with event fractures'
# Print the subjects in fractures by accesing the underlyning Spark Dataframe
fractures.subjects.show()
+-----------+
| patientID|
+-----------+
| 2004542113|
| 2005776078|
| 2006239148|
| 2010216184|
|OBS14560354|
|20041169084|
| 2008224193|
| 200939615|
|OBS13310749|
| 2004523723|
| 2004534539|
| 2005379633|
| 2005431072|
| 2005626376|
| 2007137674|
| 2008192992|
| 2009235674|
|OBS10445642|
| 2005355358|
| 2007128097|
+-----------+
only showing top 20 rows
# Show the Events in fractures by accesing the underlyning Spark Dataframe
fractures.events.show()
+-----------+--------+--------------------+-----------------+------+-------------------+----+
| patientID|category| groupID| value|weight| start| end|
+-----------+--------+--------------------+-----------------+------+-------------------+----+
|XXXXXXXXXXX| outcome| Rachis|hospitalized_fall| 2.0|2014-02-07 00:00:00|null|
|XXXXXXXXXXX| outcome| ColDuFemur|hospitalized_fall| 3.0|2011-10-13 00:00:00|null|
|XXXXXXXXXXX| outcome| BassinRachis|hospitalized_fall| 2.0|2014-07-08 00:00:00|null|
|XXXXXXXXXXX| outcome| Ribs|hospitalized_fall| 4.0|2011-01-31 00:00:00|null|
|XXXXXXXXXXX| outcome|MembreSuperieurPr...|hospitalized_fall| 2.0|2011-04-06 00:00:00|null|
|XXXXXXXXXXX| outcome| ColDuFemur|hospitalized_fall| 3.0|2013-04-03 00:00:00|null|
|XXXXXXXXXXX| outcome| ColDuFemur|hospitalized_fall| 2.0|2013-04-15 00:00:00|null|
|XXXXXXXXXXX| outcome| Rachis|hospitalized_fall| 2.0|2014-08-06 00:00:00|null|
|XXXXXXXXXXX| outcome| FemurExclusionCol|hospitalized_fall| 3.0|2012-05-13 00:00:00|null|
|XXXXXXXXXXX| outcome| Ribs|hospitalized_fall| 4.0|2012-05-16 00:00:00|null|
|XXXXXXXXXXX| outcome| Rachis|hospitalized_fall| 2.0|2010-09-28 00:00:00|null|
|XXXXXXXXXXX| outcome| Rachis|hospitalized_fall| 2.0|2010-09-28 00:00:00|null|
|XXXXXXXXXXX| outcome| Rachis|hospitalized_fall| 2.0|2010-08-20 00:00:00|null|
|XXXXXXXXXXX| outcome| Poignet|hospitalized_fall| 2.0|2014-04-18 00:00:00|null|
|XXXXXXXXXXX| outcome| Poignet|hospitalized_fall| 3.0|2014-08-21 00:00:00|null|
|XXXXXXXXXXX| outcome| Bassin|hospitalized_fall| 2.0|2011-11-21 00:00:00|null|
|XXXXXXXXXXX| outcome| Jambe|hospitalized_fall| 3.0|2010-01-22 00:00:00|null|
|XXXXXXXXXXX| outcome| ColDuFemur|hospitalized_fall| 3.0|2011-11-09 00:00:00|null|
|XXXXXXXXXXX| outcome| Poignet|hospitalized_fall| 2.0|2014-04-30 00:00:00|null|
|XXXXXXXXXXX| outcome| Rachis|hospitalized_fall| 2.0|2010-02-05 00:00:00|null|
|XXXXXXXXXXX| outcome| FemurExclusionCol|hospitalized_fall| 3.0|2011-12-14 00:00:00|null|
+-----------+--------+--------------------+-----------------+------+-------------------+----+
only showing top 20 rows
# How many subjects are in our fractures cohort?

print('Number of subjects in Fractures Cohort is {}'.format(fractures.subjects.count()))
Number of subjects in Fractures Cohort is 157043
In the following line we want to exclude from our fractures Cohort subjects that are exposed in our study. We will thus use the difference.
fractures_without_exposures = fractures.difference(cc.get('exposures'))# Desribe fractures_without_exposures
fractures_without_exposures.describe()'Events are fractures. Events contain only subjects with event fractures without subjects with event exposures.'
# How many subjects are left compared to the original fractures cohort?
print('Number of subjects in Fractures Cohort with Exposed subjects is {}'.format(fractures_without_exposures.subjects.count()))
Number of subjects in Fractures Cohort with Exposed subjects is 47553
Amazing! We have lost roughly 110k due to their presence in the Exposures Cohort. Lets do the intersection now, and check that intersection + difference = original cohort.
fractures_with_exposures = fractures.intersection(cc.get('exposures'))
print(fractures_with_exposures.describe())
print('Number of subjects in Fractures Cohort with Exposed subjects is {}'.format(fractures_with_exposures.subjects.count()))
Events are fractures. Events contain only subjects with event fractures with subjects with event exposures.
Number of subjects in Fractures Cohort with Exposed subjects is 109490
We can verify that 47553 + 109490 = 157043.
Data scientist like to explore with descriptive and visual stats. SCALPEL-Analysis already implement a variety of stats in the stats package. The stats range from: subjects stats such as distribution per age bucket and gender, to duration stats that allows to see the distribution of Event duration. You can fully explore the available library by clicking on the link.
All the stats function has the same signature
def plot_function(cohort: Cohort, figure: Figure) -> Figure:This allows, for example, to iterate over a registry and calling the method without fully knowing it. Every group of stats functions available are grouped in registry variable.
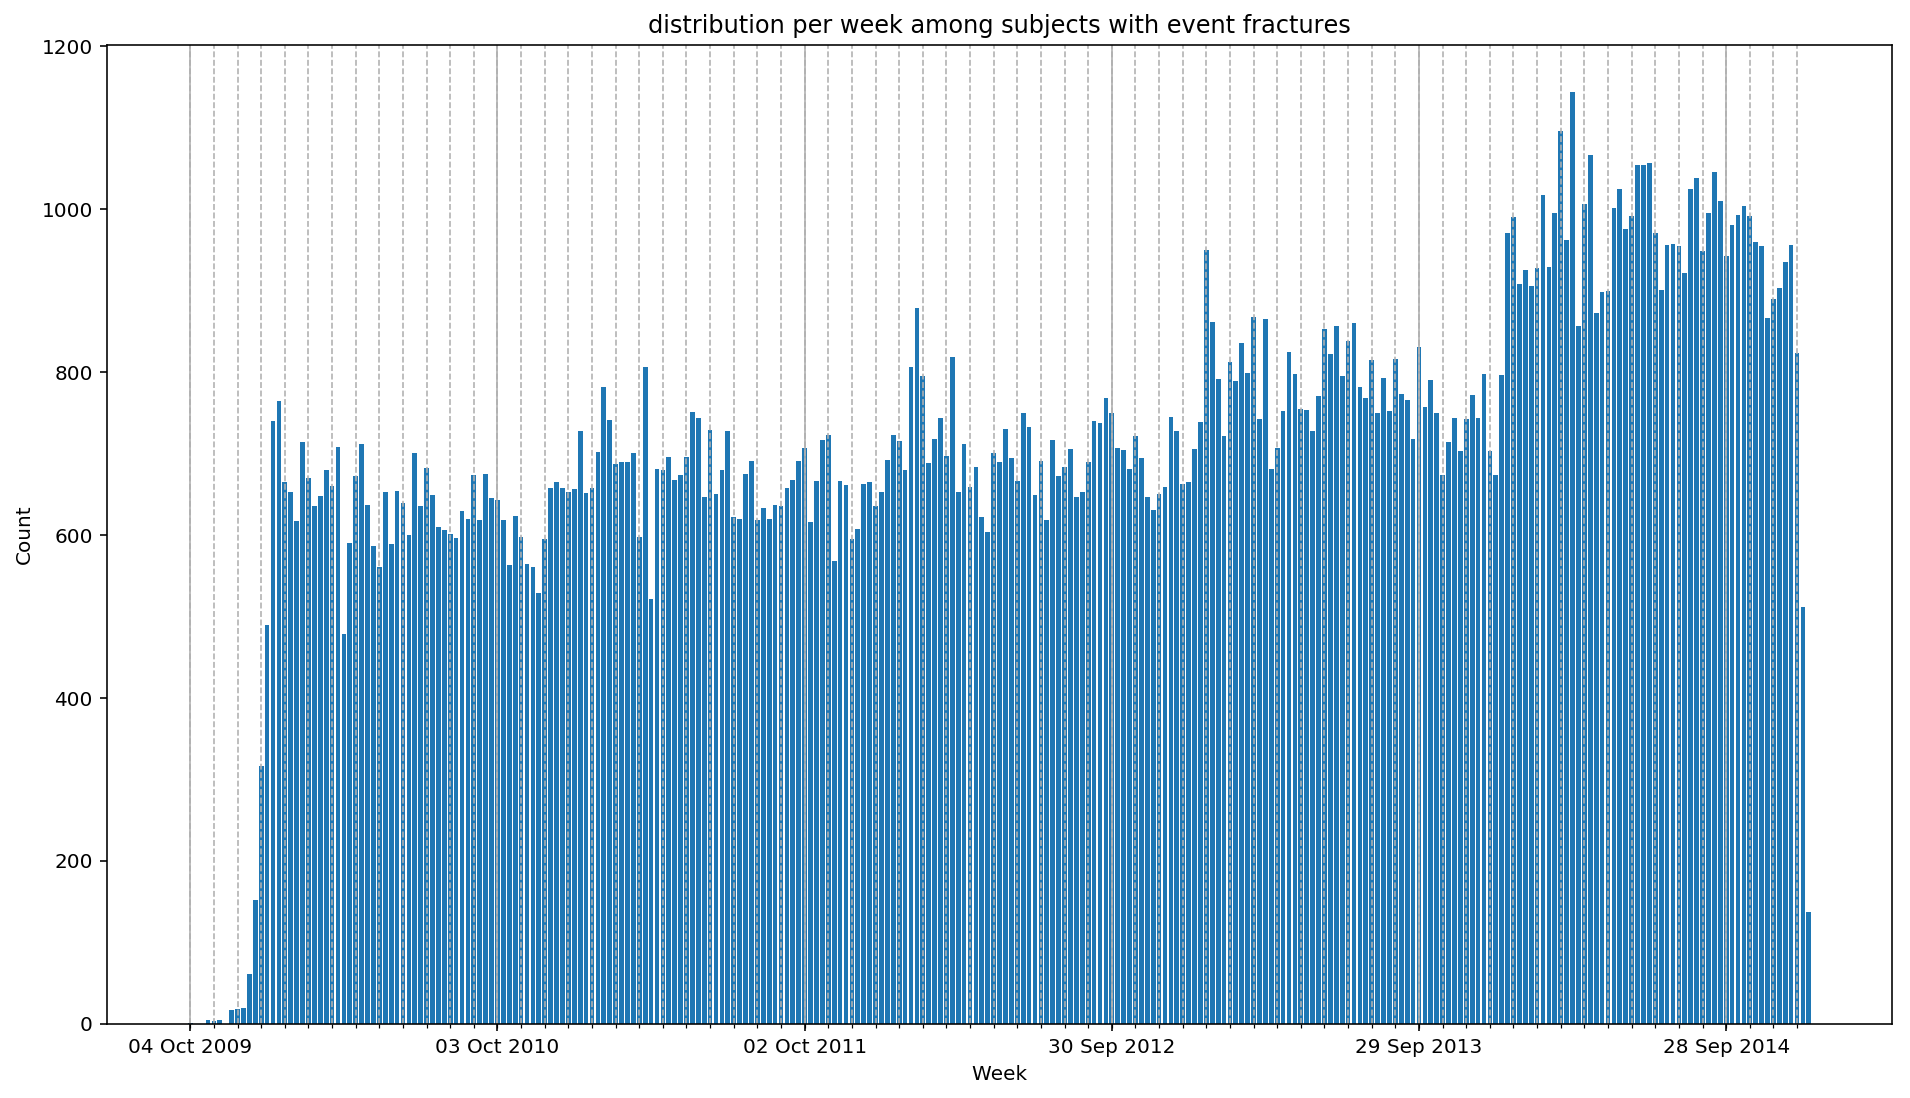
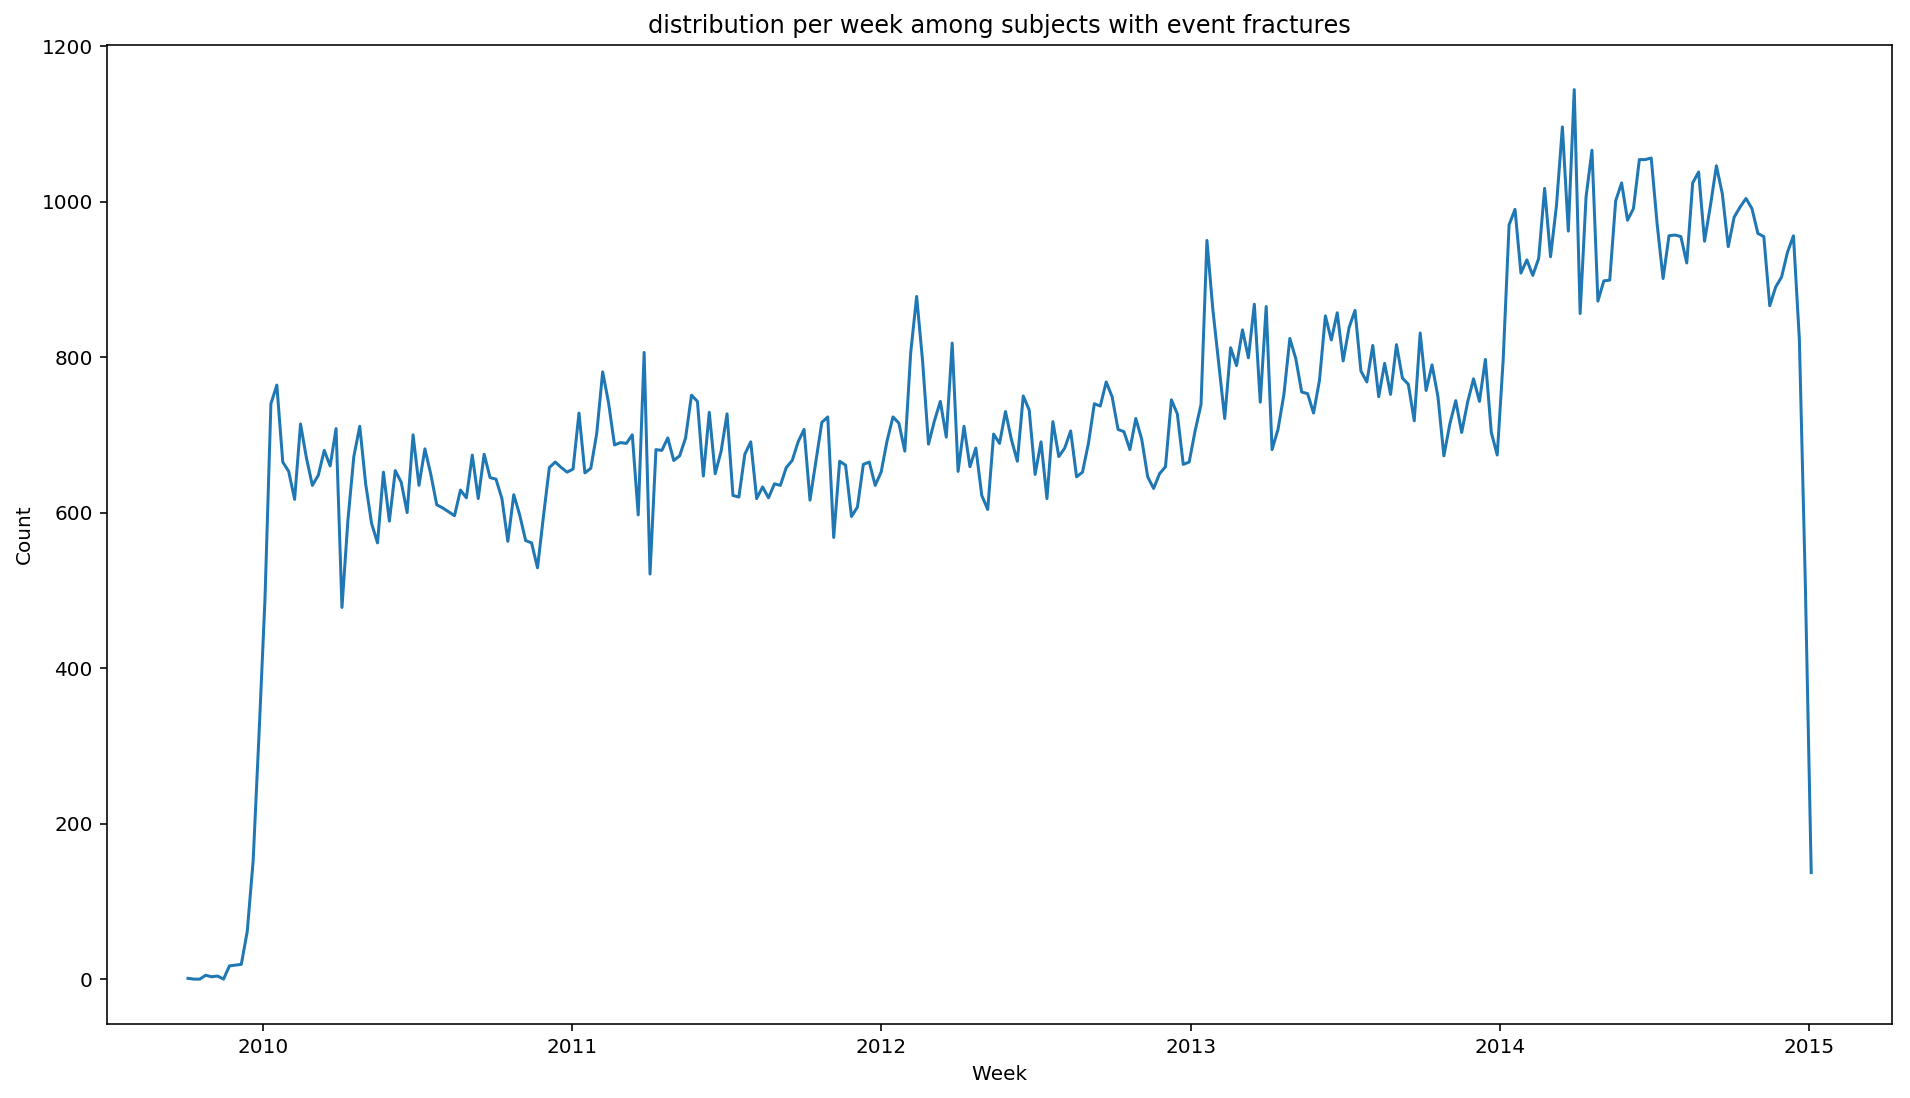
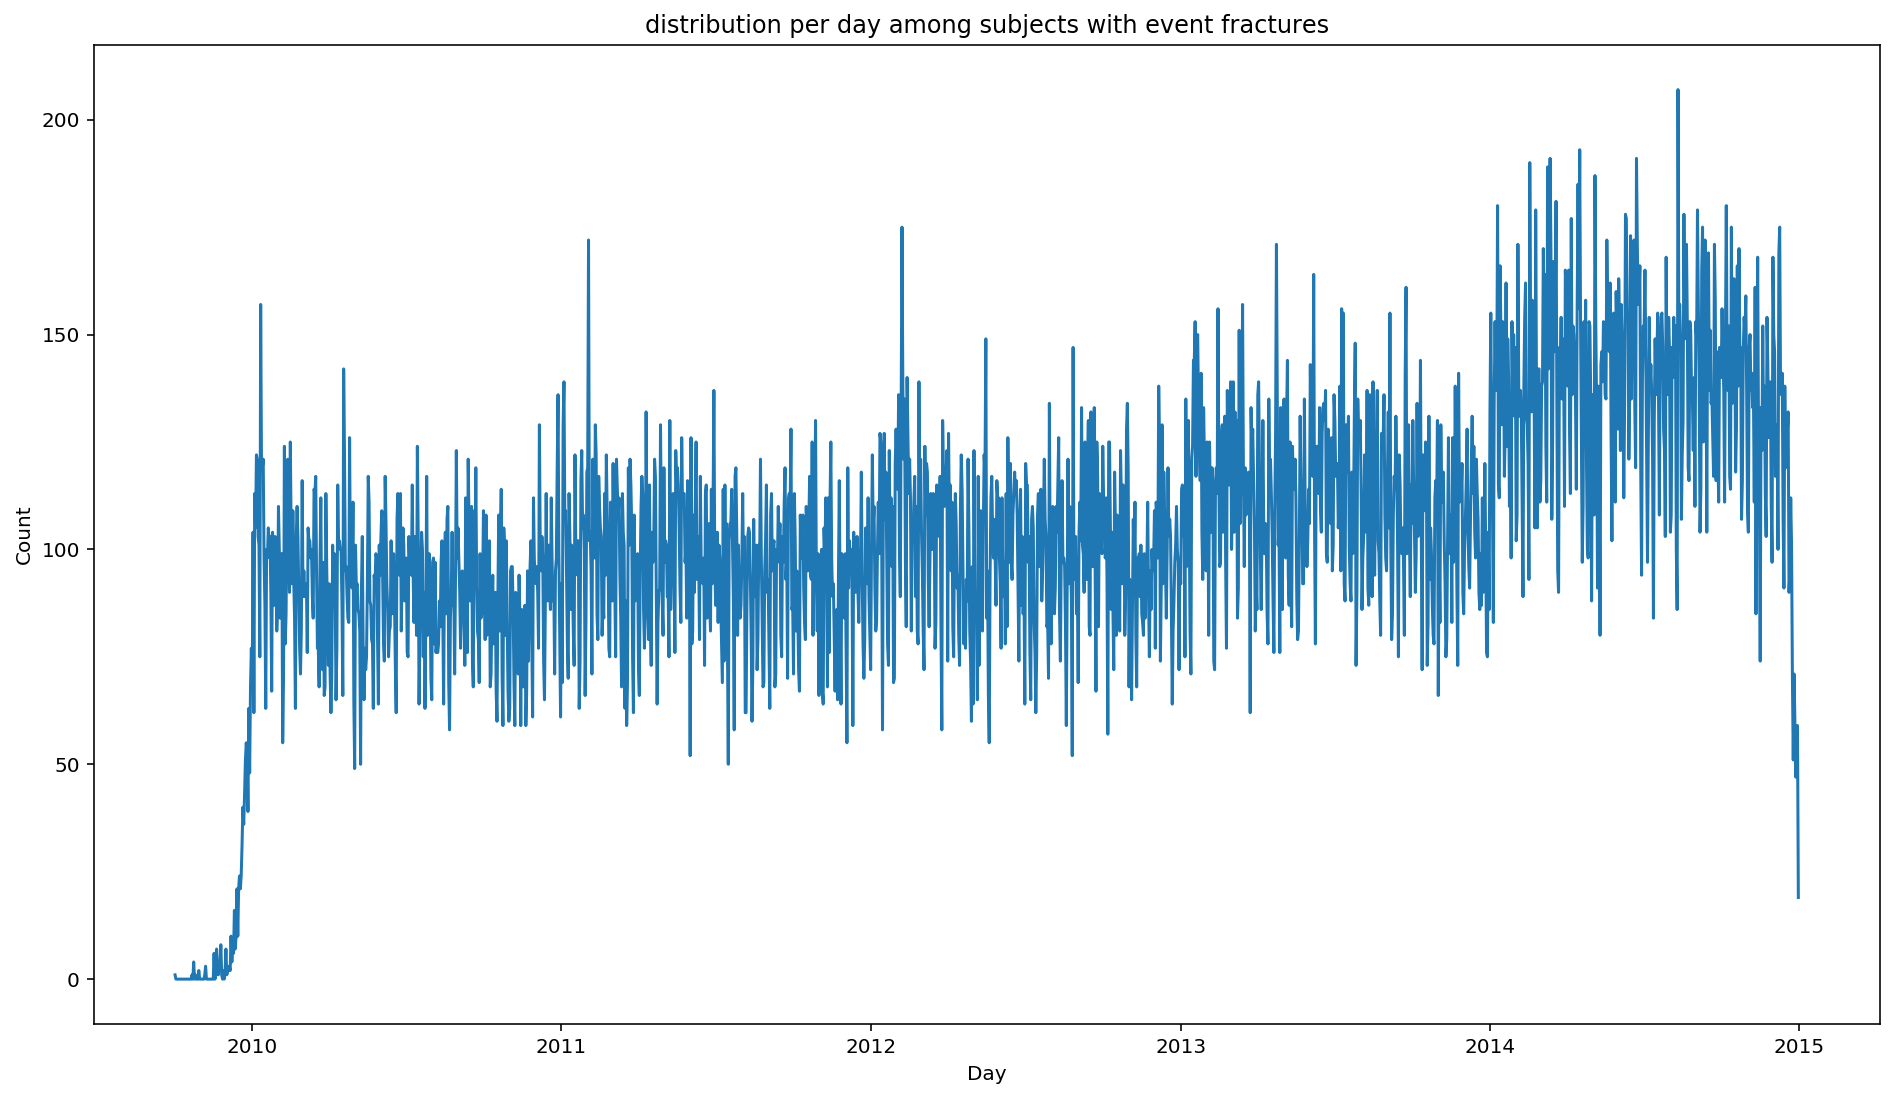
For instance, we want to plot the distribution of fractures over time.
from scalpel.stats.event_distribution import registry

import matplotlib.pyplot as plt
for plot in registry:
figure = plt.figure(figsize=(16, 9))
plot(cohort=fractures, figure=figure)


You may have already asked your self the question: what if my analysis needs something that SCALPEL-Analysis does not implement? Well, in that case, you can easily switch to the beloved Spark DataFrames to do whatever complex analysis came up through your mind, and go back to the Cohort at the end.
For the purpose of illustration, suppose you want a Cohort of subjects that has suffered a ColDuFemur fracture. This kind of filter is not ready available in Cohort, as we believe it is not necessary to implement something that can easily done in Spark. Have a look below for the answer of this question.
# You will need the necessary import of Pyspark
import pyspark.sql.functions as fn

# First get the ColDuFemur events
col_femur_fractures = fractures.events.where(fn.col('groupID') == 'ColDuFemur')

# Second create the Cohort
from scalpel.core.cohort import Cohort

col_de_femur_cohort = Cohort(
    'Col Du Femur fractures',
    'Subjects with Col Du Femur fractures',
    col_femur_fractures.select('patientID').distinct(),
    col_femur_fractures
)col_de_femur_cohort.describe()'Events are Col Du Femur fractures. Events contain only Subjects with Col Du Femur fractures.'
col_de_femur_cohort.events.show()+-----------+--------+----------+-----------------+------+-------------------+----+
| patientID|category| groupID| value|weight| start| end|
+-----------+--------+----------+-----------------+------+-------------------+----+
|XXXXXXXXXXX| outcome|ColDuFemur|hospitalized_fall| 3.0|2011-10-13 00:00:00|null|
|XXXXXXXXXXX| outcome|ColDuFemur|hospitalized_fall| 3.0|2013-04-03 00:00:00|null|
|XXXXXXXXXXX| outcome|ColDuFemur|hospitalized_fall| 2.0|2013-04-15 00:00:00|null|
|XXXXXXXXXXX| outcome|ColDuFemur|hospitalized_fall| 3.0|2011-11-09 00:00:00|null|
|XXXXXXXXXXX| outcome|ColDuFemur|hospitalized_fall| 3.0|2012-10-26 00:00:00|null|
|XXXXXXXXXXX| outcome|ColDuFemur|hospitalized_fall| 3.0|2013-04-25 00:00:00|null|
|XXXXXXXXXXX| outcome|ColDuFemur|hospitalized_fall| 3.0|2014-07-14 00:00:00|null|
|XXXXXXXXXXX| outcome|ColDuFemur|hospitalized_fall| 2.0|2011-02-01 00:00:00|null|
|XXXXXXXXXXX| outcome|ColDuFemur|hospitalized_fall| 3.0|2013-06-14 00:00:00|null|
|XXXXXXXXXXX| outcome|ColDuFemur|hospitalized_fall| 2.0|2011-10-21 00:00:00|null|
|XXXXXXXXXXX| outcome|ColDuFemur|hospitalized_fall| 3.0|2012-05-17 00:00:00|null|
|XXXXXXXXXXX| outcome|ColDuFemur|hospitalized_fall| 3.0|2012-04-26 00:00:00|null|
|XXXXXXXXXXX| outcome|ColDuFemur|hospitalized_fall| 3.0|2012-01-13 00:00:00|null|
|XXXXXXXXXXX| outcome|ColDuFemur|hospitalized_fall| 2.0|2012-08-25 00:00:00|null|
|XXXXXXXXXXX| outcome|ColDuFemur|hospitalized_fall| 3.0|2012-09-03 00:00:00|null|
|XXXXXXXXXXX| outcome|ColDuFemur|hospitalized_fall| 3.0|2010-05-11 00:00:00|null|
|XXXXXXXXXXX| outcome|ColDuFemur|hospitalized_fall| 3.0|2014-08-29 00:00:00|null|
|XXXXXXXXXXX| outcome|ColDuFemur|hospitalized_fall| 3.0|2013-04-27 00:00:00|null|
|XXXXXXXXXXX| outcome|ColDuFemur|hospitalized_fall| 3.0|2014-10-27 00:00:00|null|
|XXXXXXXXXXX| outcome|ColDuFemur|hospitalized_fall| 3.0|2013-02-12 00:00:00|null|
+-----------+--------+----------+-----------------+------+-------------------+----+
only showing top 20 rows
Same goes when you want an analytical question such as: how many fractures are there by site?
fractures.events.groupBy(fn.col('groupID')).count().show()+--------------------+-----+
| groupID|count|
+--------------------+-----+
| Dent| 302|
| Jambe| 5226|
|MembreInferieurDi...| 6750|
| Cheville| 7181|
| Poignet| 8461|
| Pied| 2146|
| Clavicule| 3784|
| Bassin| 7404|
|MembreSuperieurPr...|13924|
| Face| 5896|
| BassinRachis| 5163|
| Ribs|12773|
| FemurExclusionCol|10688|
| CoudeAvantBras| 4489|
| ColDuFemur|55398|
| Crane| 1271|
| Rachis|21877|
| Doigt| 4661|
| CraneFace| 883|
|MembreSuperieurDi...|16707|
+--------------------+-----+
only showing top 20 rows