Diagnostics
Quokka provides a number of functions which may loosely be called 'diagnostic' in nature. These are:
- Packet Capture: Quokka will use the 'scapy' tool to capture packets to/from specific IP addresses or services. The result is a list of captured packets, which can be expanded to examine the specific contents of each packet.
- Port Scan: Quokka will use the 'nmap' tool to scan hosts, looking for open ports. Quokka uses either a simple TCP port scan, or an extended scan, which does deeper probing and analysis. The result is nmap output showing the host and port information.
- Traceroute: Quokka will perform a scapy traceroute to determine the layer 3 route between the source (the quokka server by default), and the specified destination. The result is an image showing the results.
Note that these diagnostic functions require sudo privileges, which should not be done directly from a web application (as is quokka), and thus are run as independent processes. And as such, these can be run remotely, called 'remote workers' in quokka, and described in detail elsewhere in this documentation.
Examples of each are shown below.
For devices, hosts, and services, quokka can perform packet captures. The following is such an example:
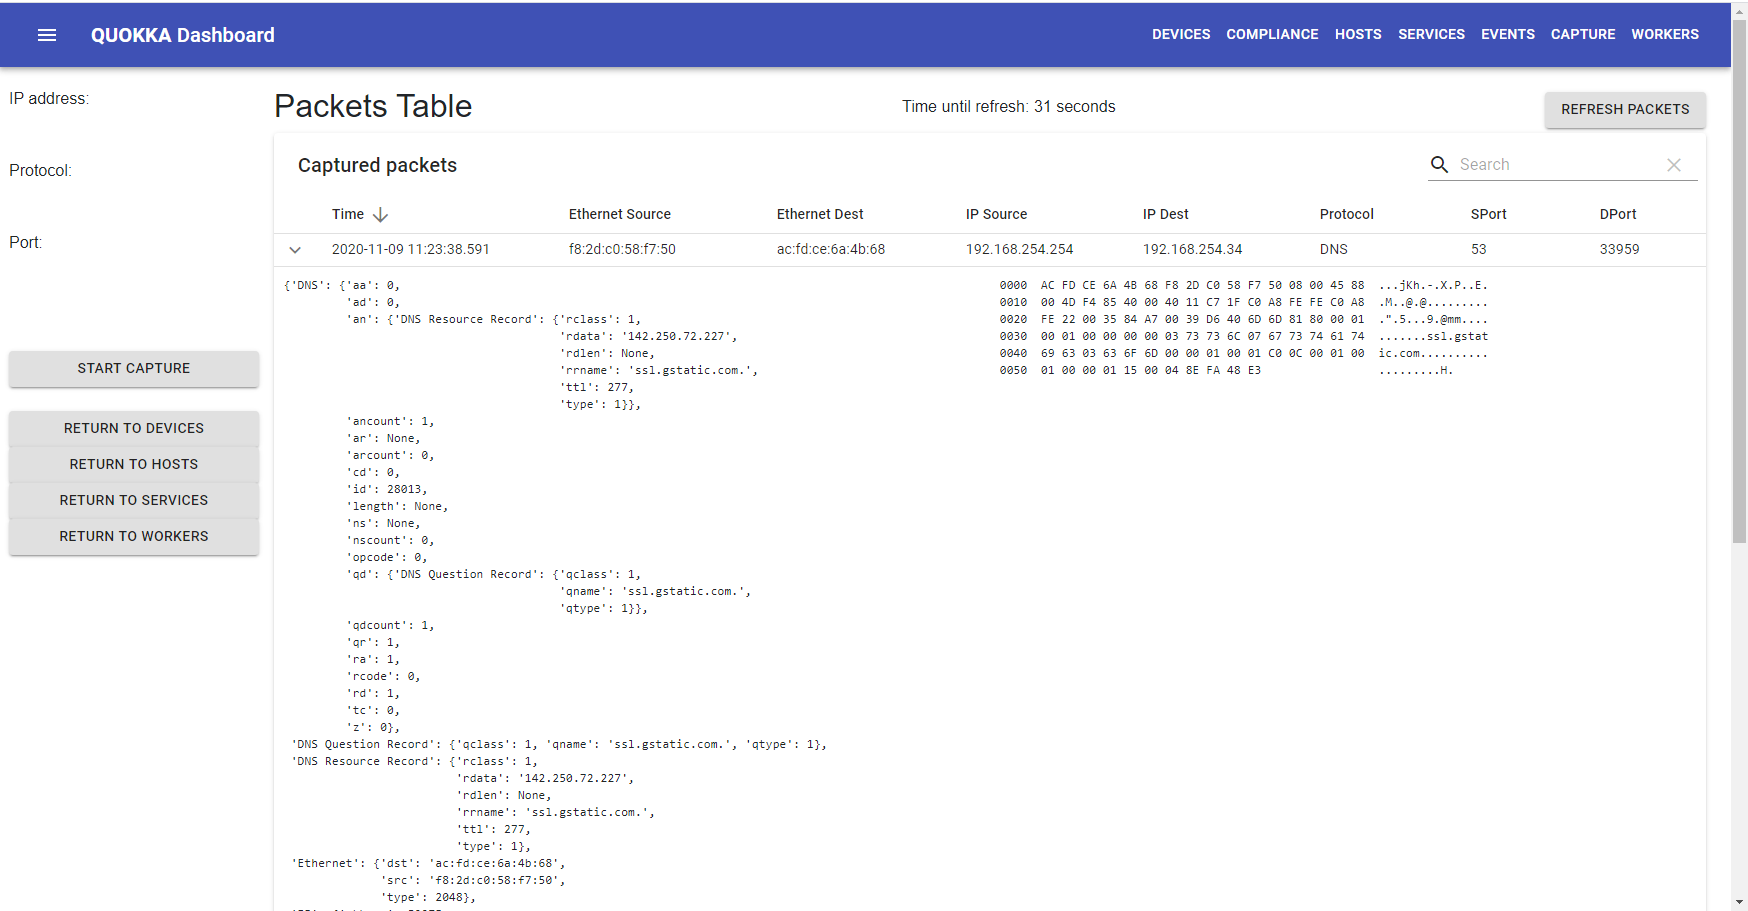
There are some important points about packet capture to be aware of:
- The user must press the "START CAPTURE" button to initiate the capture. I.e. the capture doesn't start automatically, you must press the button.
- It will take a while for packets to begin to appear - remember that this is a web interface, and as you can see at the top of the screen, in the "Time until refresh", the screen is only updated every minutes.
- There may be limited packets captured - remember that quokka can only capture what it can see.
In addition, the specifics of what is captured depends on the place from where the capture was initiated:
- For devices, packets that match the IP address of the device are captured.
- For hosts, packets that match the IP address of the host are captured.
- For services, packets that match the service's TCP/UDP port are captured. Note that we don't also filter based on the 'target', since this may be either a hostname, or may not even apply.
Regarding the table itself, we display the time, Ethernet source/destination, IP source/destination, protocol, and source/destination port. You can click the arrow at the far left of the screen, to expand and see the details of the specific packet.
For hosts only, it is possible to do a port scan. There are two types of port scan:
- The leftmost portscan button initiates a simple TCP port scan, which doesn't require sudo privileges, and does not require a separate process ('worker') to perform the action. The result is a list of the open TCP ports.
- The rightmost portscan button initiates an extended port scan, which will end up being processed by the separate process. This scan examines the host and attempts to determine the OS, and also performs a deeper and more involved scan of potentially open ports on the host.
Note: Unlike packet capture, the port scanning will commence when you click on the button on the hosts list. As the popup window says, it may take a while to get the results, depending entirely on how long it takes nmap to complete the process. I have observed it to be as quick as a few seconds, or as long as a minute or more.
The following images are two captures of all the information retrieved from an extended port scan of a Windows laptop.


The information presented in the port scan output comes directly from nmap, the library used to perform the scan. It includes (not an exhaustive list):
- command_line: This is the actual command line that was used to initiate the nmap scan.
- addresses: The IP and MAC addresses for the host.
- hostnames: The hostnames that nmap discovered for the host.
- osmatch: This is information about the attempts to match the scan information nmap received, to an actual OS. There may be multiple items in this section, each with a probability.
- tcp: This is information about each of the ports that nmap determined were open, with associated information about each.
###Trace Route
Traceroute can be initiated for devices, hosts, or services. Traceroute determines the layer 3 path to the destination device, host, or service; if there are no router hopes (e.g. the host is in your local network), then the result will be empty. If however, the destination is something like a service (e.g. www.google.com), or a Cisco sandbox device (in the cloud), then the results can be quite interesting.
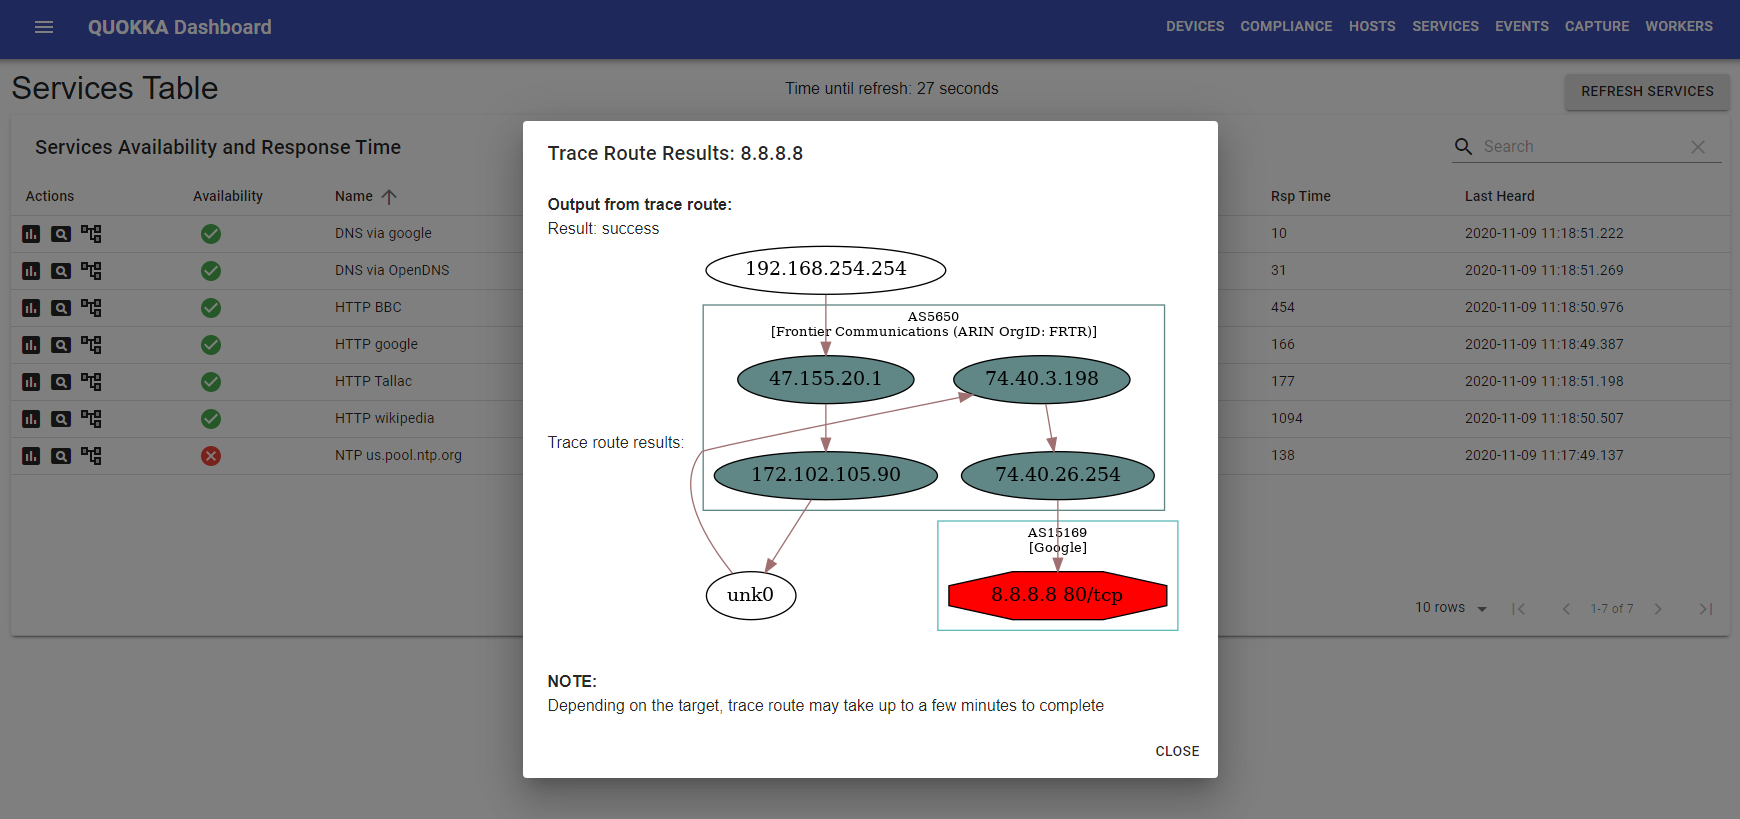
In the example above, I have done a traceroute to Google's nameserver, 8.8.8.8. The first set of routers represents my own ISP (Frontier), and from there it apparently goes directly to the Google nameserver. This is not surprising actually, since you'd want multiple instances of your nameserver to have information cached, and be located as near as possible to the requesting users.