| version: | Python 3.9, 3.10, 3.11, 3.12 |
|---|---|
| contributions: | Please join https://github.com/cokelaer/colormap |
| issues: | Please use https://github.com/cokelaer/colormap/issues |
| notebook: | Please see https://github.com/cokelaer/colormap/tree/main/notebooks |
colormap package provides utilities to convert colors between RGB, HEX, HLS, HUV and a framework to easily create and build colormaps for matplotlib. All matplotlib colormaps and some R colormaps are also available altogether. The plot_colormap method (see below) is handy to quickly pick up a colormaps and the test_colormap is useful to see a live version of the new colormap.
pip install colormap
- convert RGB to HEX:
from colormap import rgb2hex, hex2rgb

hex_color = rgb2hex(255, 0, 0)  # Red color in HEX
print(hex_color)  # Output: "#ff0000"

rgb_color = hex2rgb("#ff0000")  # Convert back to RGB
print(rgb_color)  # Output: (255, 0, 0)
- Generate a Custom colormap:
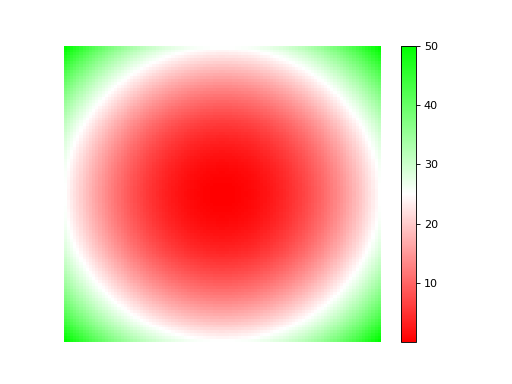
Create your own colormap. For instance, from red to green colors with intermediate color as whitish (diverging map from red to green):
from colormap import Colormap
c = Colormap()
mycmap = c.cmap( {'red':[1,1,0], 'green':[0,1,.39], 'blue':[0,1,0]})
cmap = c.test_colormap(mycmap)
Even simpler if the colormap is linear using color's name:
from colormap import Colormap
c = Colormap()
mycmap = c.cmap_linear('red', 'white', 'green(w3c)')
cmap = c.test_colormap(mycmap)
- Visualise existing matplotlib colormap:
from colormap import plot_colormap, plot_category
plot_colormap("viridis")
Using the Colormap instance, you can see all valid names using:
c.colormaps
Matplotlib is very well known in the PYthon ecosystem and has categorised colormaps into categories such as a "diverging". To visualise all of them:
plot_category('diverging')
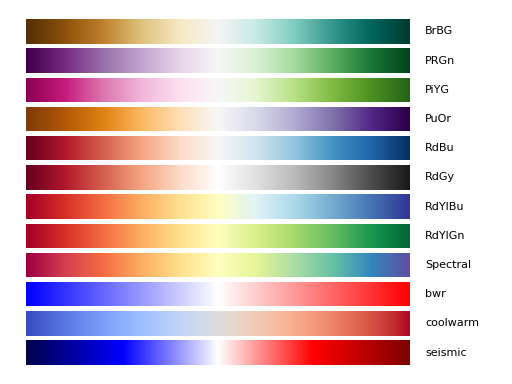
Other sets of colormaps are : sequentials, sequentials2, misc, diverging, qualitative
See online documentation for details: http://colormap.readthedocs.io/
| Version | Description |
|---|---|
| 1.3.0 |
|
| 1.2.0 | |
| 1.1.0 |
|
| 1.0.6 |
|
| 1.0.5 |
|