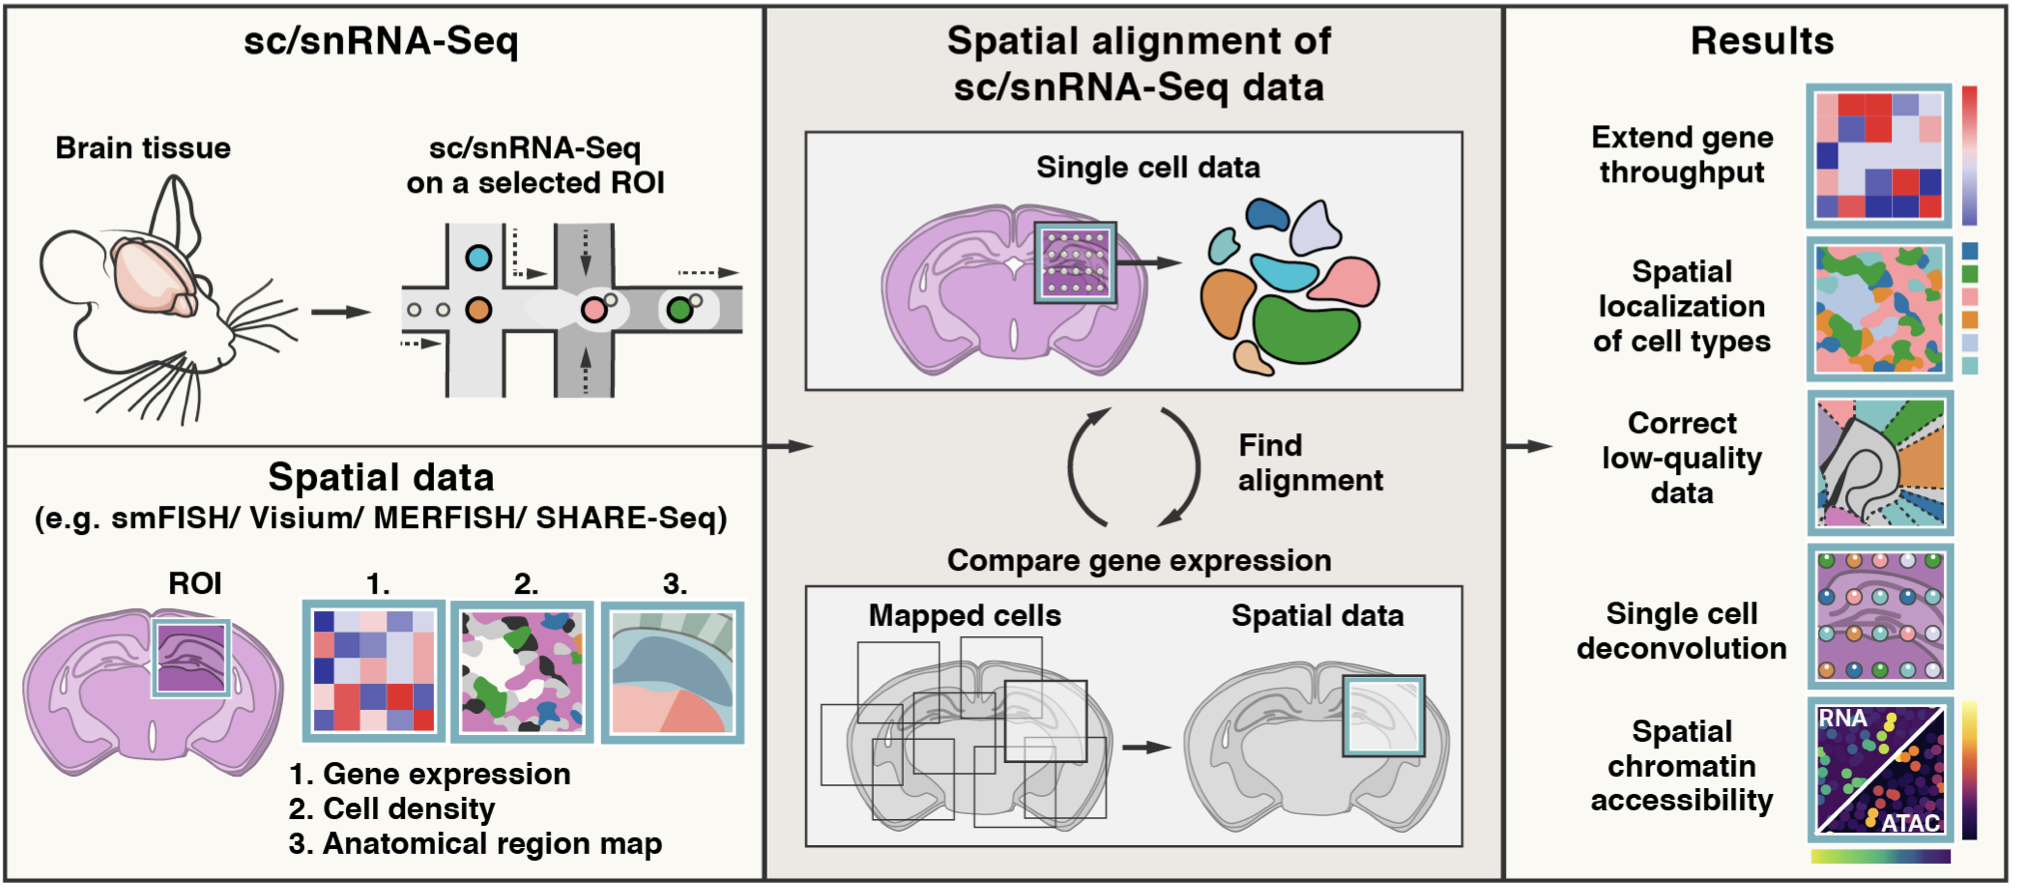
Tangram is a Python package, written in PyTorch and based on scanpy, for mapping single-cell (or single-nucleus) gene expression data onto spatial gene expression data. The single-cell dataset and the spatial dataset should be collected from the same anatomical region/tissue type, ideally from a biological replicate, and need to share a set of genes. Tangram aligns the single-cell data in space by fitting gene expression on the shared genes. The best way to familiarize yourself with Tangram is to check out our tutorial and our documentation.
If you don't use squidpy yet, check out our previous tutorial.
To install Tangram, make sure you have PyTorch and scanpy installed. If you need more details on the dependences, look at the environment.yml file.
- set up conda environment for Tangram
conda env create -f environment.yml
- install tangram-sc from shell:
    conda activate tangram-env
    pip install tangram-sc
- To start using Tangram, import tangram in your jupyter notebooks or/and scripts
import tangram as tg
Load your spatial data and your single cell data (which should be in AnnData format), and pre-process them using tg.pp_adatas:
    ad_sp = sc.read_h5ad(path)
    ad_sc = sc.read_h5ad(path)
    tg.pp_adatas(ad_sc, ad_sp, genes=None)
The function pp_adatas finds the common genes between adata_sc, adata_sp, and saves them in two adatas.uns for mapping and analysis later. Also, it subsets the intersected genes to a set of training genes passed by genes. If genes=None, Tangram maps using all genes shared by the two datasets. Once the datasets are pre-processed we can map:
ad_map = tg.map_cells_to_space(ad_sc, ad_sp)
The returned AnnData,ad_map, is a cell-by-voxel structure where ad_map.X[i, j] gives the probability for cell i to be in voxel j. This structure can be used to project gene expression from the single cell data to space, which is achieved via tg.project_genes.
ad_ge = tg.project_genes(ad_map, ad_sc)
The returned ad_ge is a voxel-by-gene AnnData, similar to spatial data ad_sp, but where gene expression has been projected from the single cells. This allows to extend gene throughput, or correct for dropouts, if the single cells have higher quality (or more genes) than spatial data. It can also be used to transfer cell types onto space.
To enable faster training and consume less memory, Tangram mapping can be done at cell cluster level. This modification was introduced by Sten Linnarsson.
Prepare the input data as the same you would do for cell level Tangram mapping. Then map using following code:
    ad_map = tg.map_cells_to_space(
                   ad_sc,
                   ad_sp,
                   mode='clusters',
                   cluster_label='subclass_label')
Provided cluster_label must belong to ad_sc.obs. Above example code is to map at 'subclass_label' level, and the 'subclass_label' is in ad_sc.obs.
To project gene expression to space, use tg.project_genes and be sure to set the cluster_label argument to the same cluster label in mapping.
    ad_ge = tg.project_genes(
                  ad_map,
                  ad_sc,
                  cluster_label='subclass_label')
Tangram instantiates a Mapper object passing the following arguments:
- S: single cell matrix with shape cell-by-gene. Note that genes is the number of training genes.
- G: spatial data matrix with shape voxels-by-genes. Voxel can contain multiple cells.
Then, Tangram searches for a mapping matrix M, with shape voxels-by-cells, where the element M_ij signifies the probability of cell i of being in spot j. Tangram computes the matrix M by maximizing the following:
where cos_sim is the cosine similarity. The meaning of the loss function is that gene expression of the mapped single cells should be as similar as possible to the spatial data G, under the cosine similarity sense.
The above accounts for basic Tangram usage. In our manuscript, we modified the loss function in several ways so as to add various kinds of prior knowledge, such as number of cell contained in each voxels.
Mapping with cluster mode is fine on a standard laptop. For mapping at single cell level, GPU is not required but is recommended. We run most of our mappings on a single P100 which maps ~50k cells in a few minutes.
A good way to start is to use the top 1k unique marker genes, stratified across cell types, as training genes. Alternatively, you can map using the whole transcriptome. Ideally, training genes should contain high quality signals: if most training genes are rich in dropouts or obtained with bad RNA probes your mapping will not be accurate.
You do not need to segment cells in your histology for mapping on spatial transcriptomics data (including Visium and Slide-seq). You need, however, cell segmentation if you wish to deconvolve the data (ie deterministically assign a single cell profile to each cell within a spatial voxel).
Reduce your spatial data in various parts and map each single part. If that is not sufficient, you will need to downsample your single cell data as well.
Tangram has been released in the following publication
Biancalani* T., Scalia* G. et al. - Deep learning and alignment of spatially-resolved whole transcriptomes of single cells in the mouse brain with Tangram Nature Methods 18, 1352–1362 (2021)
If you have questions, please contact the authors of the method:
- Tommaso Biancalani - [email protected]
- Gabriele Scalia - [email protected]
PyPI maintainer:
- Hejin Huang - [email protected]
- Shreya Gaddam - [email protected]
- Tommaso Biancalani - [email protected]
- Ziqing Lu - [email protected]
The artwork has been curated by:
- Anna Hupalowska [email protected]


