TornadoTrax is a web application that serves as a visual archive and path tracker for every documented tornado in the United States from 1950 to 2022. This project provides users with an interactive map displaying tornado tracks, along with essential information such as tornado ratings, date and time, fatalities, injuries, distance, and maximum width.
A live version can be viewed here
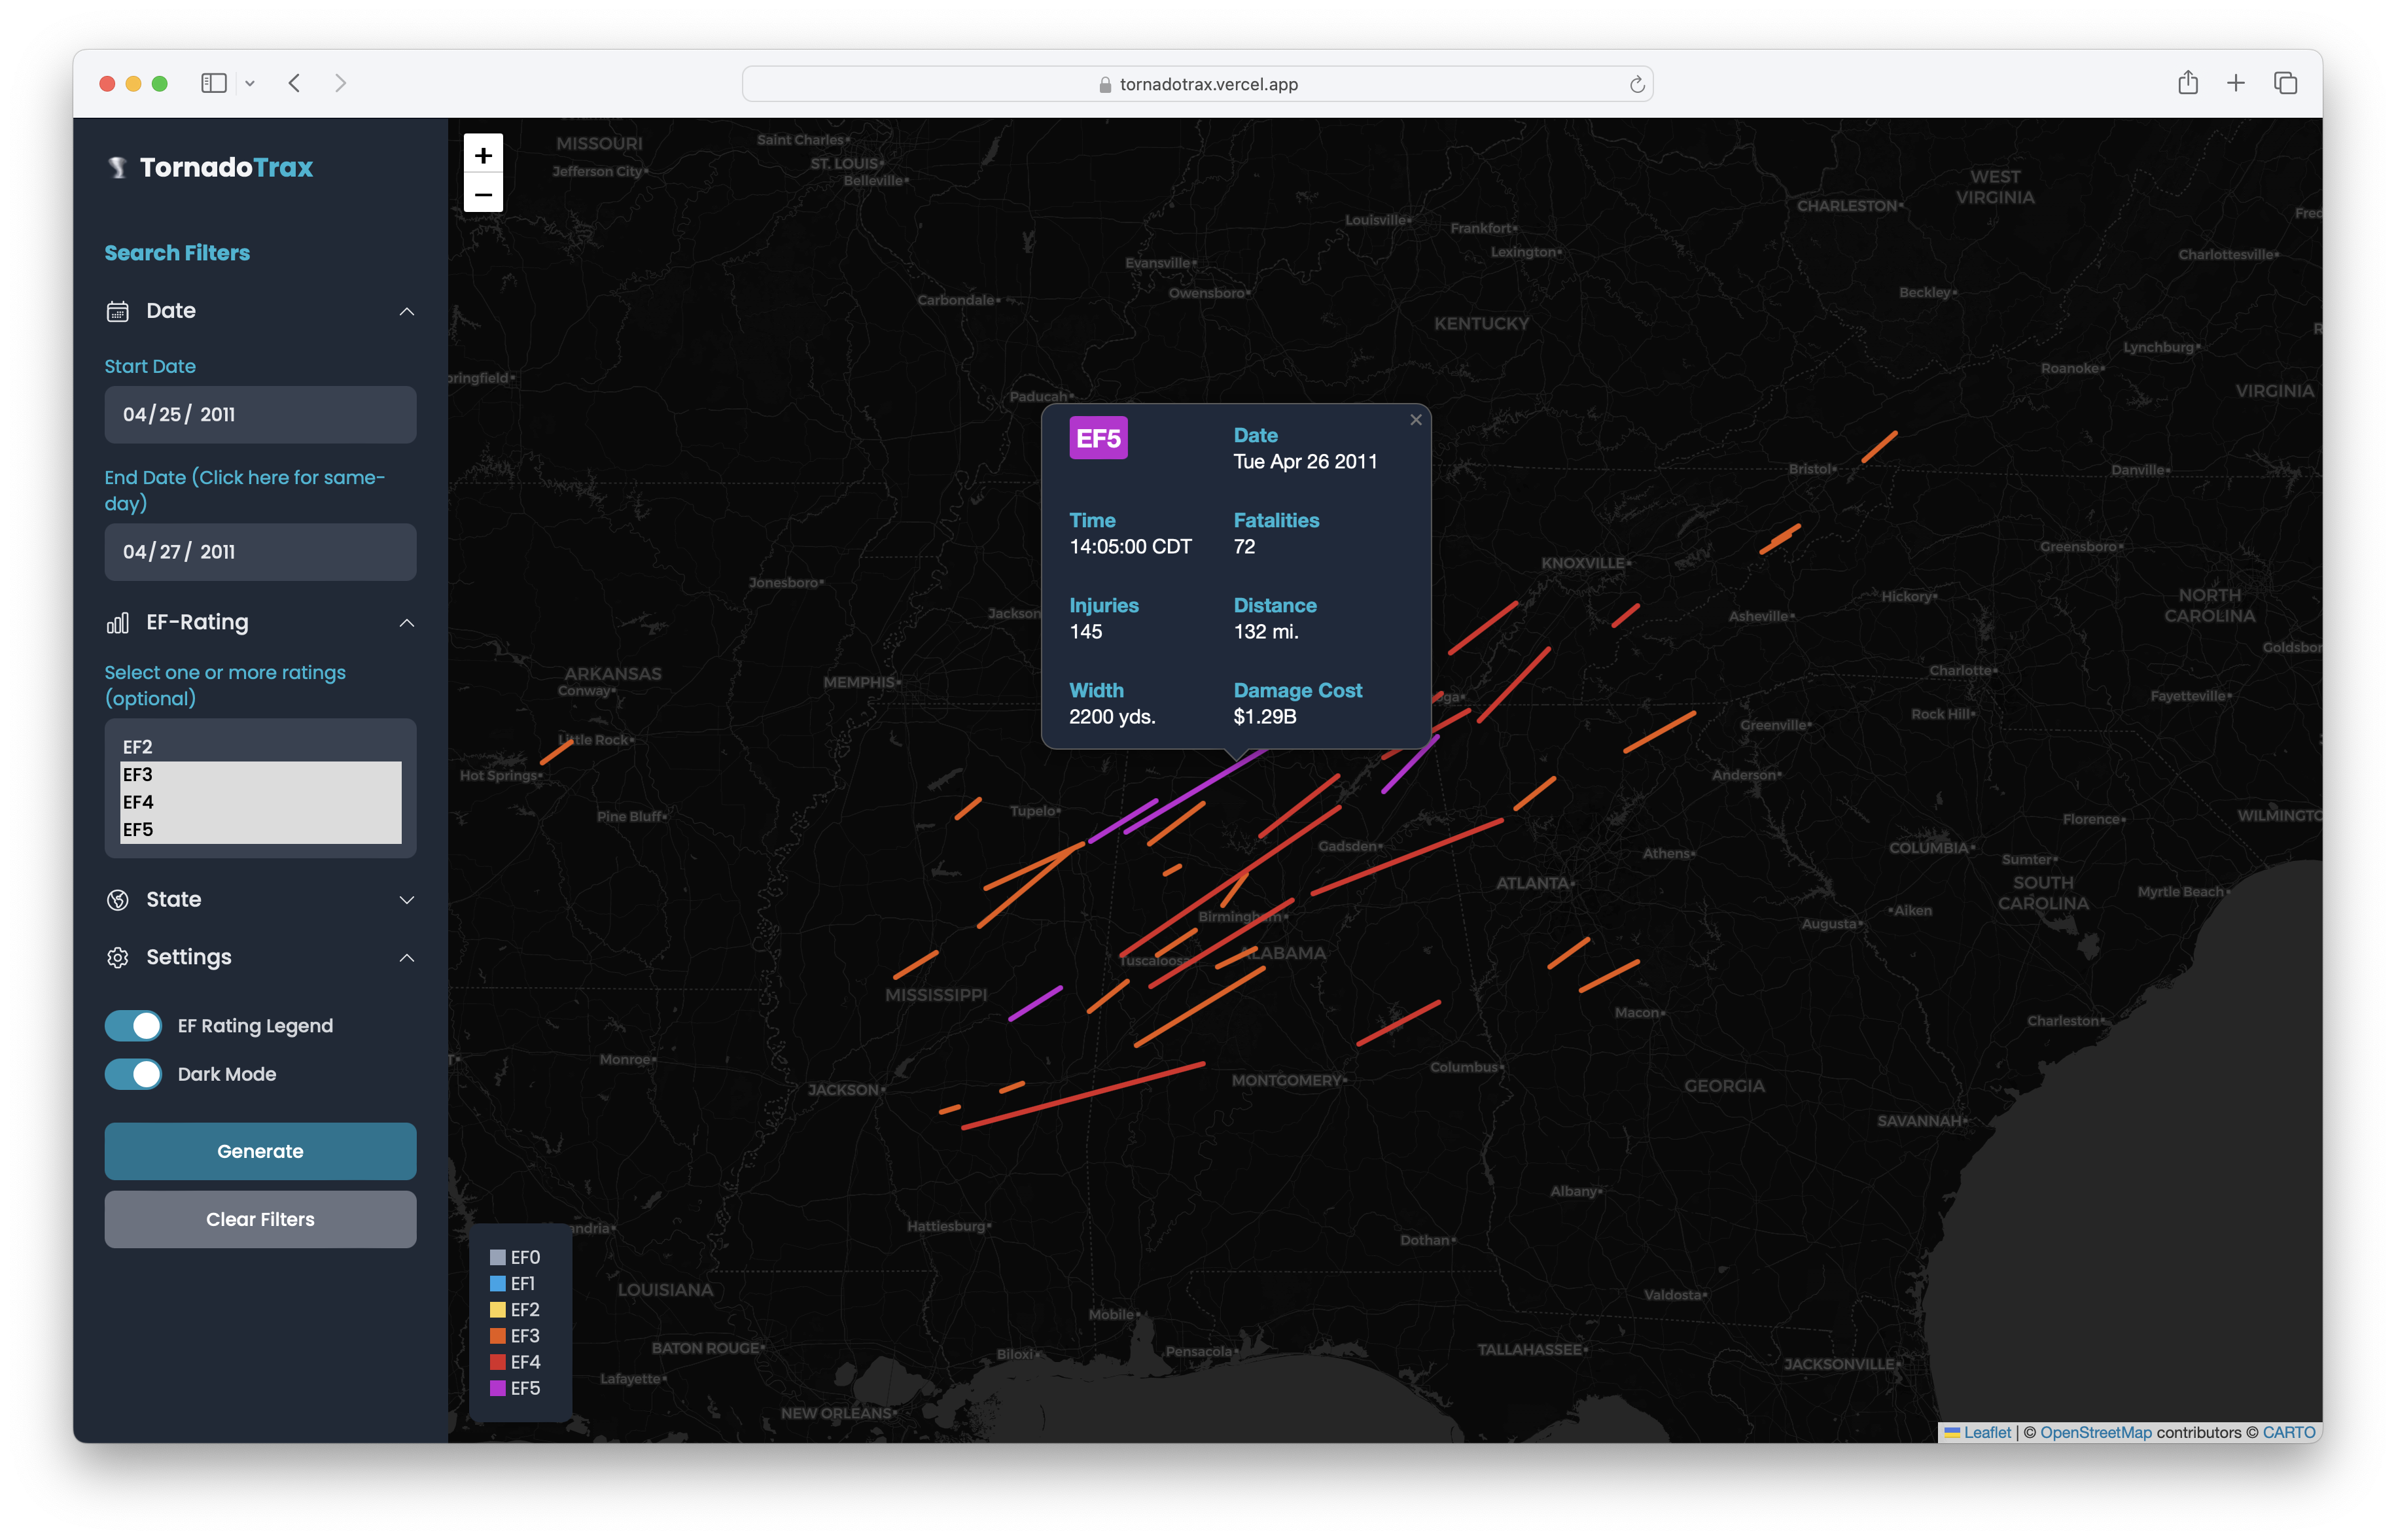
- Interactive Map: Explore tornado tracks on an interactive map powered by Leaflet.
- Filter by State: Filter tornado events based on the selected state(s).
- Filter by Date: Filter tornado events based on the selected date range.
- Filter by Rating: Filter tornado events based on the rating(s) selected.
- Legend: A legend displays the Enhanced Fujita (EF) ratings, allowing users to understand the severity of tornadoes based on the color-coded legend.
- Settings: Now contains settings to change the overall user experience of the app.
- Vue.js: The frontend is built using Vue.js, a progressive JavaScript framework.
- Leaflet: The Leaflet library is used for creating interactive maps.
- JSON Data: Tornado data is sourced from a Nestjs API, but a JSON file included in the project. The data came directly from the Storm Prediction Center, found here
The project consists of two main components:
- Home.vue: The main Vue.js view that handles the user interface, state management, and data filtering.
- TornadoMapComponent.vue: A reusable Vue.js component responsible for rendering the Leaflet map and displaying tornado tracks.
The idea behind this application is to find meaningful ways of displaying data in an interactive way. Being able to see tornado paths on a map of a state in a given year is pretty neat, but there's a lot of extrapolation that could make the app more robust.
- In a future release, TornadoTrax will include some form of Time Series Analysis, which will implement charts to display the frequency of tornadoes over time, average magnitudes per year, and changes in injuries/fatalities or economic losses. These are just some rough ideas. The popup that appears when clicking on a tornado path provides a cursory view of this information, but different structuring methods combined with user options to filter and sort the data will make TornadoTrax a powerful tool for hobbyists and researchers alike.
- I'm still considering implementing Detail Cards to replace or expand upon the information popup a user sees when clicking on a tornado path. I'd like to include some additional information like notable events or communities affected, etc.. Some other ideas spawn from this one, such as organizing notable weather events into clusters and incorporating that into the map/chart/data presentation.
- As more ideas emerge, I'll place them here. Feel free to contact me if there's a specific feature you'd like to see. Better yet, fork!
- An API is being actively developed to improve the capabilities and filtering of data without putting all of the burden on the client. It can be viewed here. A production release is currently live.
To run TornadoTrax locally, follow these steps:
-
Clone the repository:
git clone https://github.com/nodesleep/TornadoTrax.git
-
Navigate to the project directory:
cd TornadoTrax -
Install dependencies:
npm install
-
Run the application:
npm run serve
-
Open your browser and go to http://localhost:5173 to view TornadoTrax. You will be able to view the UI and the application itself, but the API is locked down so you won't be able to retrieve data.
Contributions to TornadoTrax are welcome! If you find any issues or have suggestions for improvements, feel free to open an issue or submit a pull request.
This project is licensed under the GNU General Public License v3.0 - see the LICENSE file for details.
Note: TornadoTrax is designed for desktop use, and a message is displayed for mobile users to inform them about the desktop-centric nature of the application.
Happy exploring tornado tracks with TornadoTrax! 🌪️